無料のAI Mermaidチャートメーカー
AI Mermaidチャートメーカーで生成されたグラフ
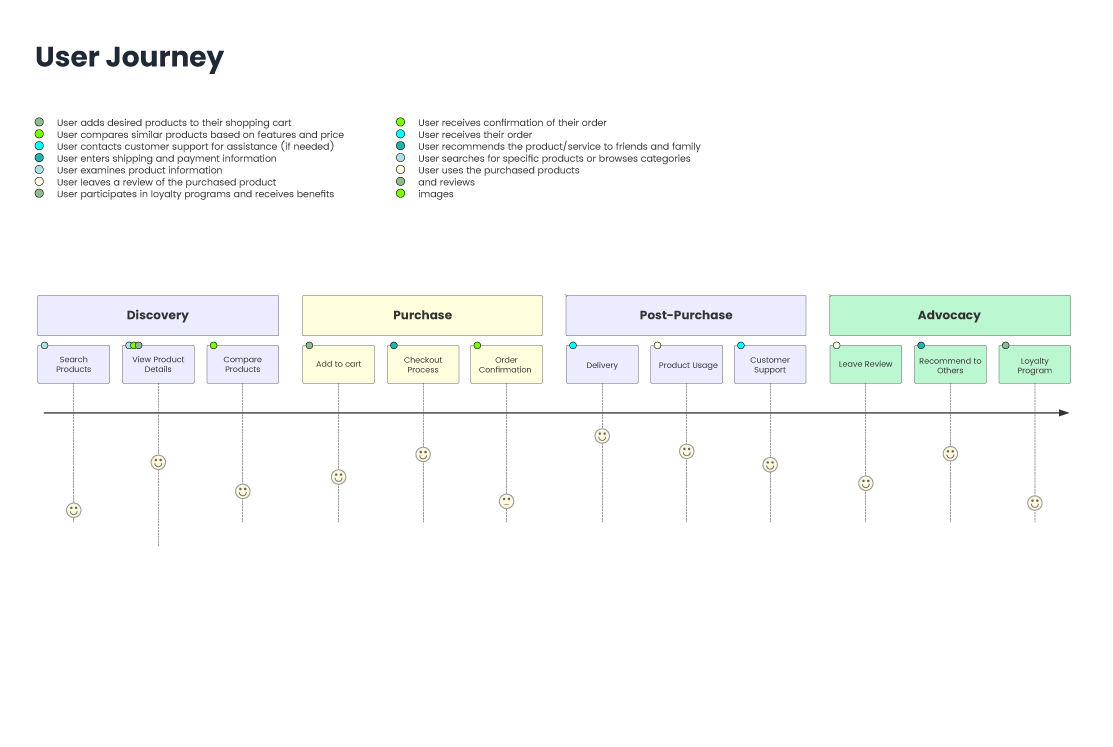
ユーザー journey
ユーザー journey ダイアグラムは、システムとのユーザーインタラクションをステップごとに視覚化するのに最適な方法です。さまざまな段階、アクション、感情にわたるユーザーエクスペリエンスをマッピングするのに役立ちます。製品設計、UX分析、またはオンボーディングフローに最適で、簡潔でテキストベースであり、ドキュメントに簡単に統合できます。
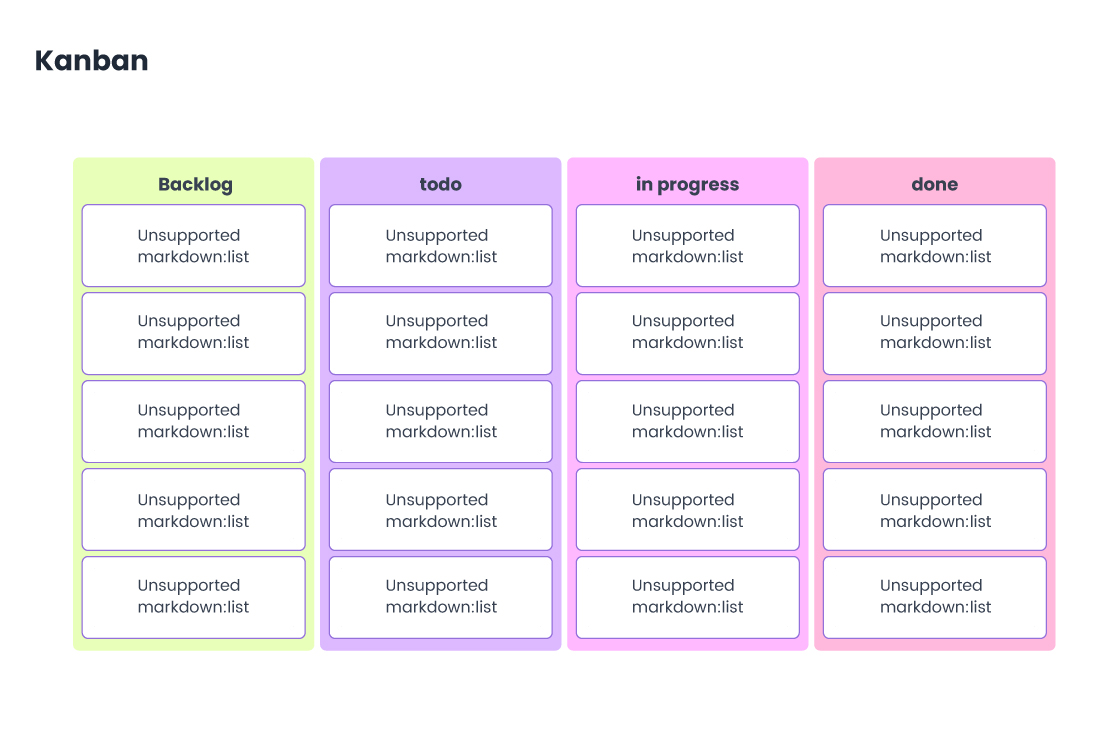
かんばん
かんばんダイアグラムは、従来のカンバンボードを模倣して、カードと列を使用してワークフローを視覚的に表現するために使用されます。「To Do」、「In Progress」、「Done」などの段階にわたってタスクを追跡するのに最適です。
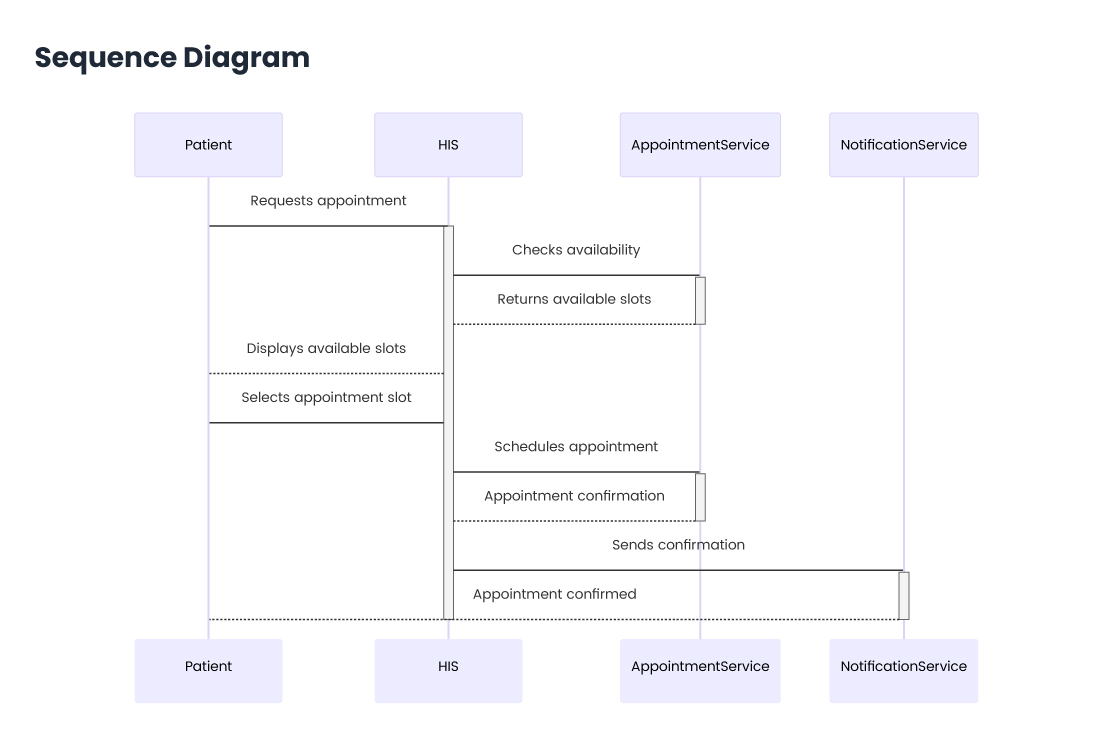
シーケンス図
シーケンス図は、プロセスまたはオブジェクトが特定の時間シーケンスでどのように相互作用するかをモデル化するために使用されます。API呼び出し、ユーザーアクション、またはサービスインタラクションなど、コンポーネント間の通信を視覚化するのに最適です。各参加者はライフラインとともに表示され、矢印は交換されるメッセージを示しているため、システムフローを理解するのに最適です。
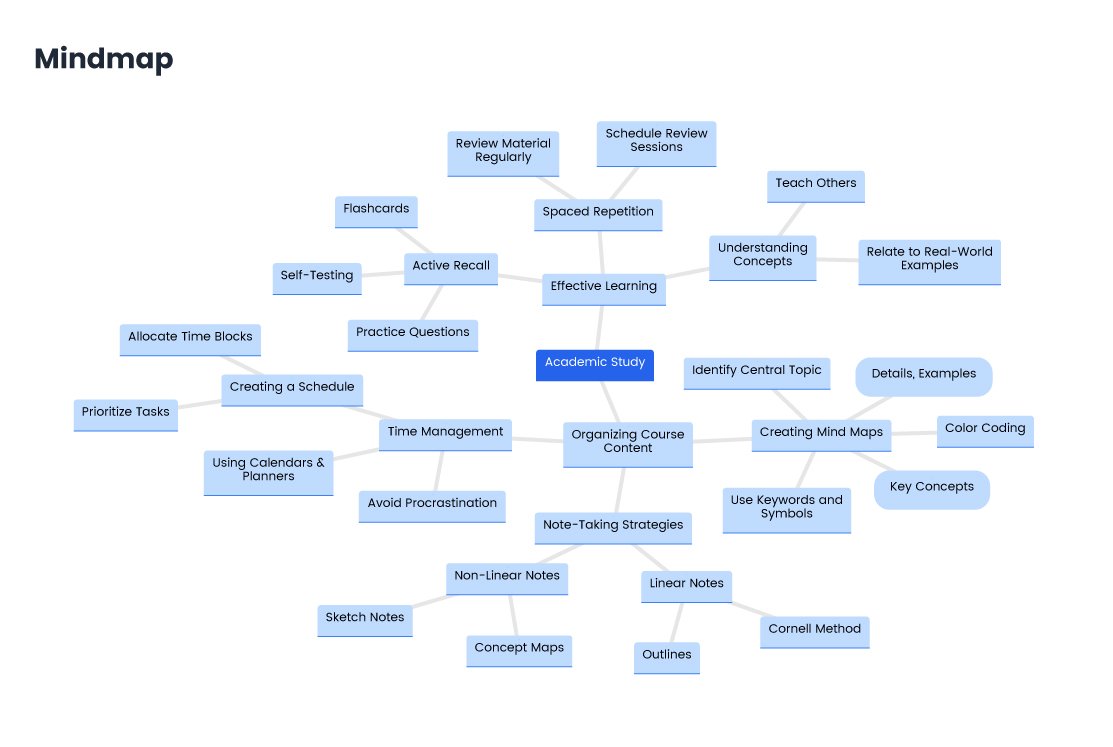
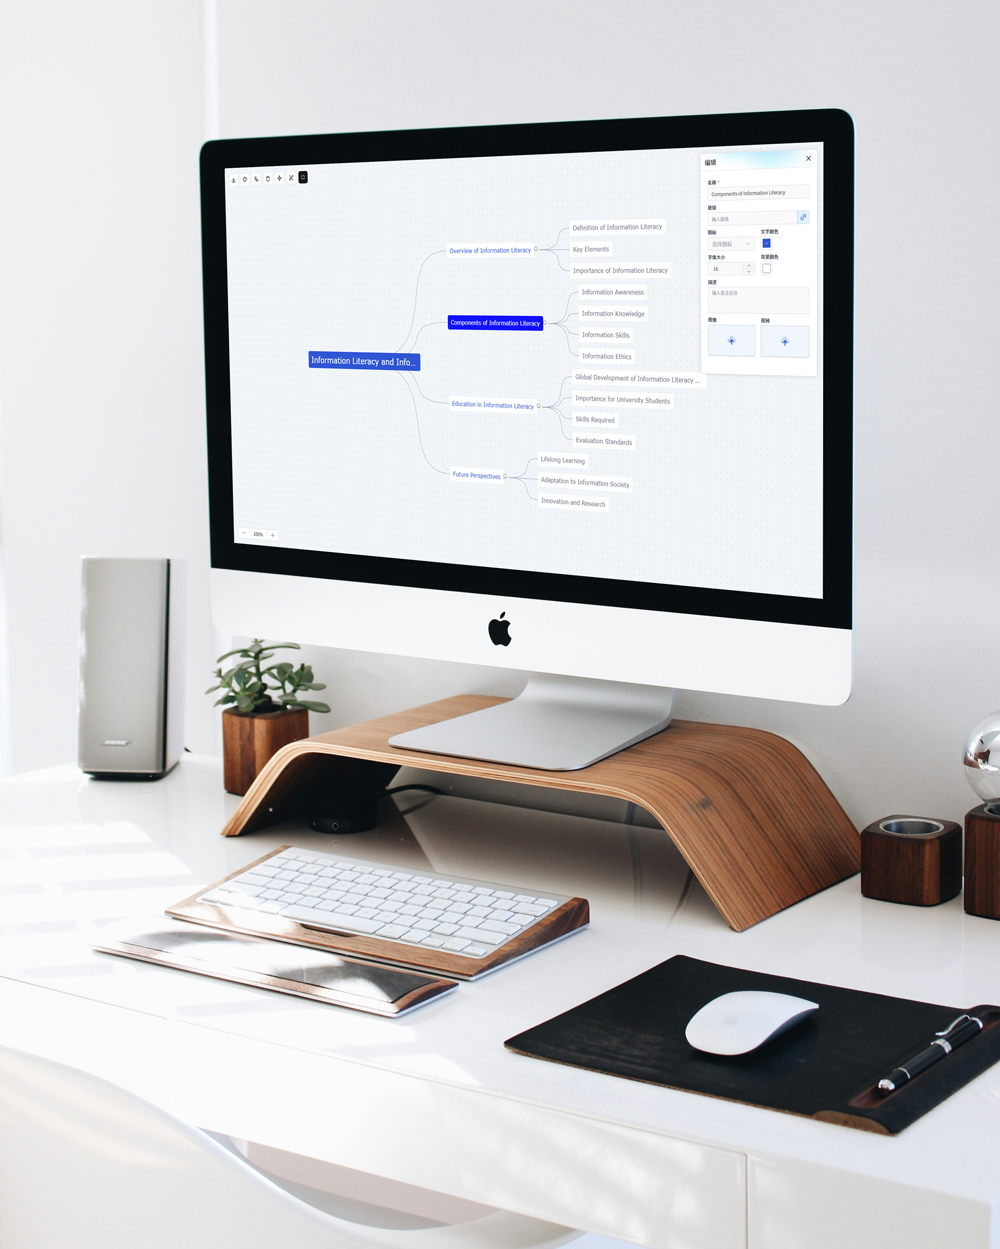
マインドマップ
Mermaidのマインドマップダイアグラムを使用すると、中心的な概念から始めて関連トピックに分岐して、階層的なアイデアを視覚的に表現できます。ブレインストーミング、アウトライン作成、知識の構造化に最適です。
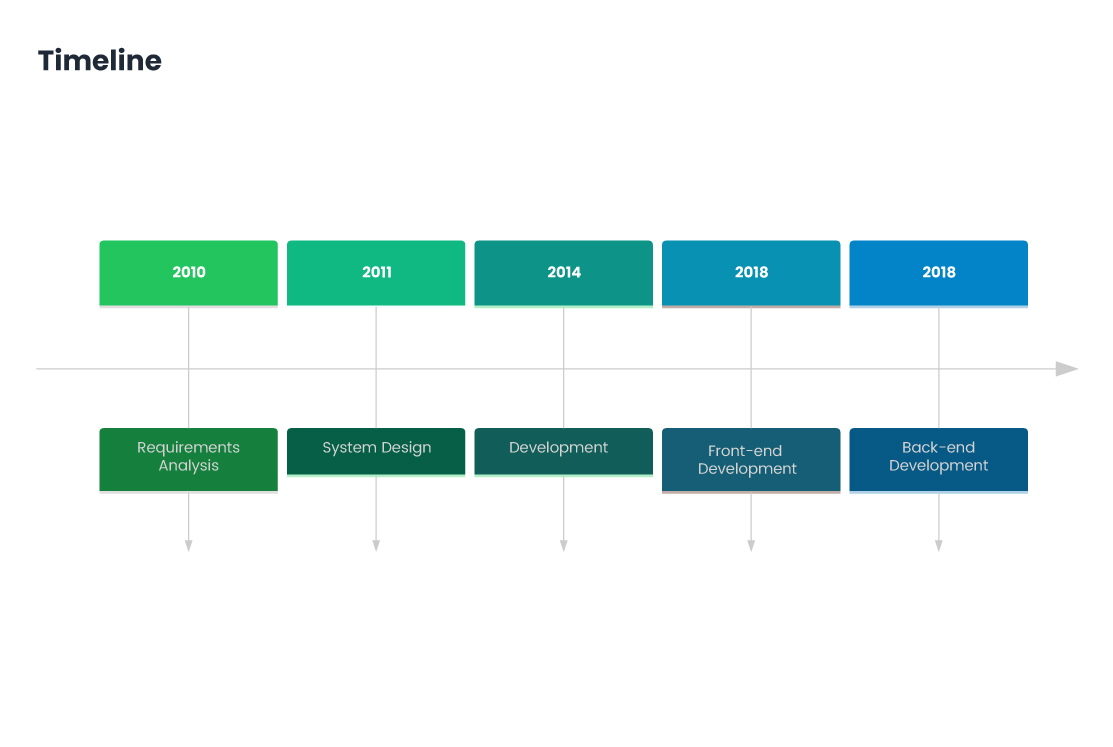
タイムライン
Mermaidのタイムラインダイアグラムは、イベントまたはマイルストーンを時系列順に視覚化するために使用されます。プロジェクトスケジュール、歴史的イベント、製品ロードマップ、または個人的な成果を紹介するのに最適です。
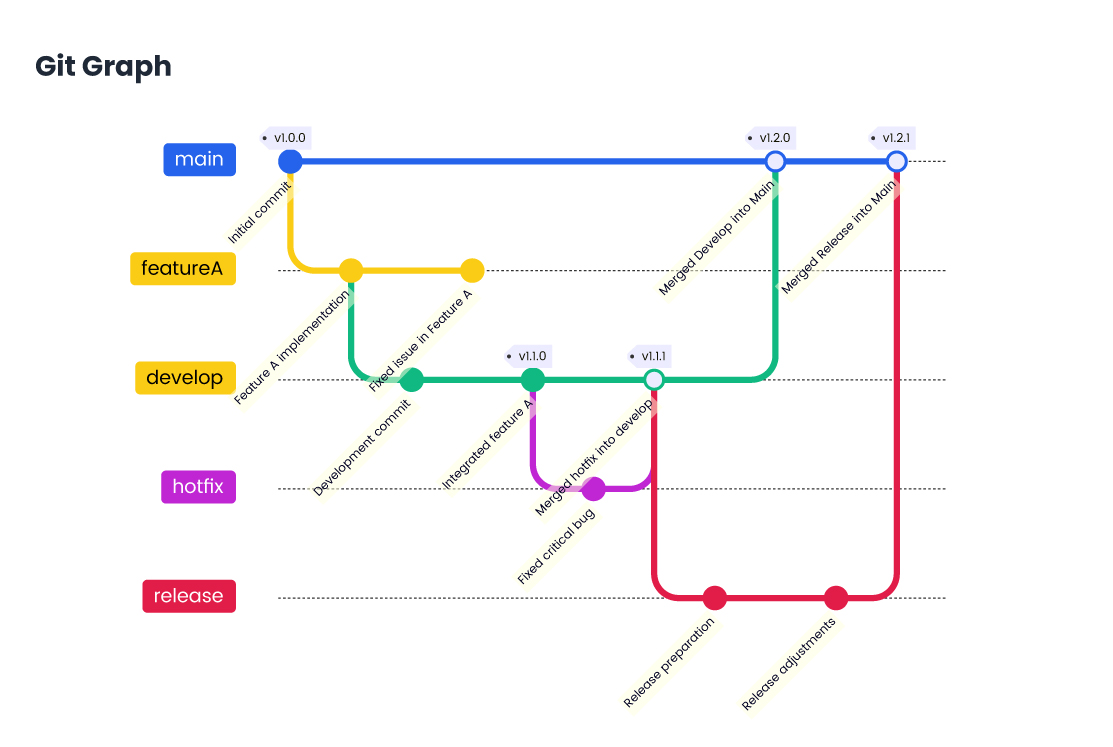
Gitグラフ
MermaidのGitグラフダイアグラムは、Gitリポジトリのコミット履歴とブランチ構造を視覚化するために使用されます。コミット、ブランチ、マージ、およびそれらの間の関係を明確な視覚形式で示します。これは、開発ワークフローを理解したり、フィーチャーブランチを追跡したり、Git全体の履歴をシンプルで読みやすいチャートで表示したりするのに役立ちます。
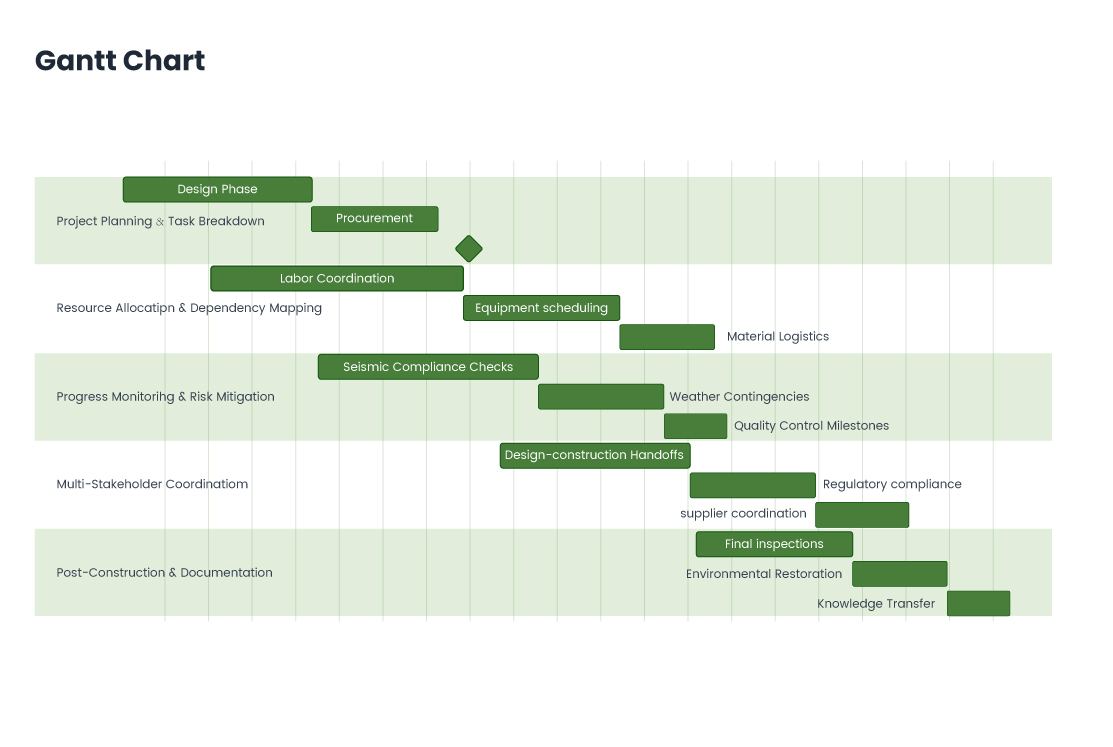
ガントチャート
Mermaidのガントチャートは、プロジェクトのタイムラインとタスクスケジュールを表すために使用されます。タスク、その期間、依存関係、およびマイルストーンをタイムラインに沿って視覚的に表示します。
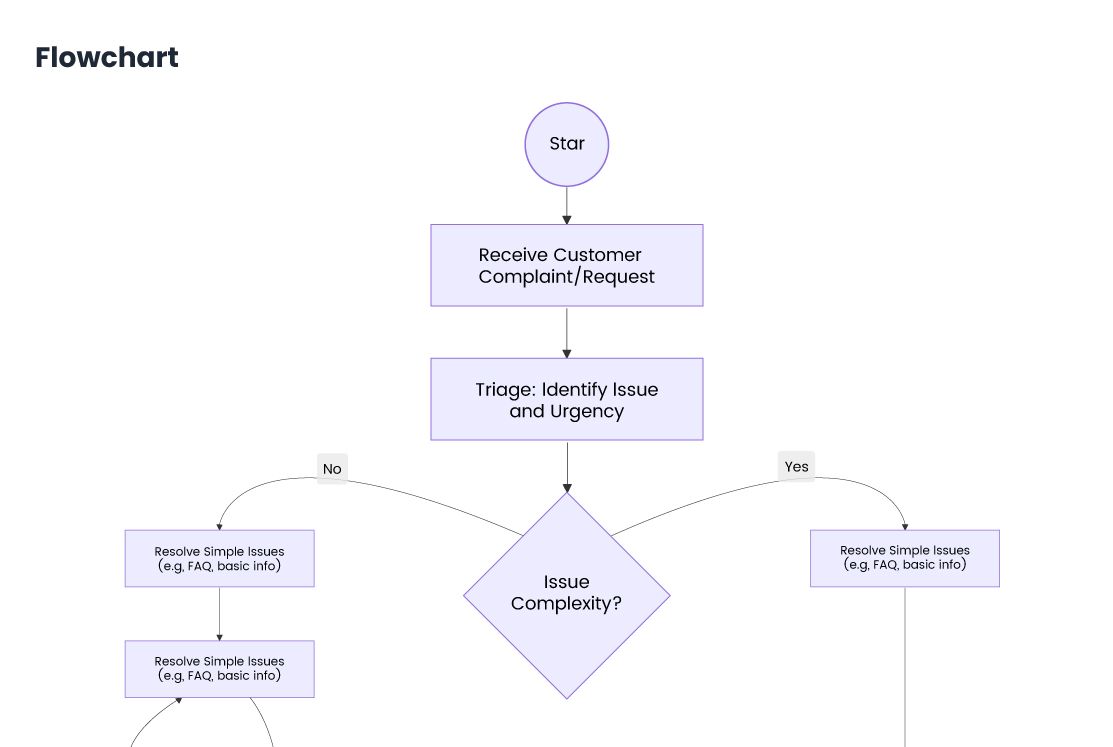
フローチャート
Mermaidのフローチャートは、プロセス、ワークフロー、または意思決定のステップを視覚的に表すために使用されるダイアグラムです。ノード(ステップまたはアクション)と矢印(フローの方向を示す)を使用して、操作のシーケンスを描写します。
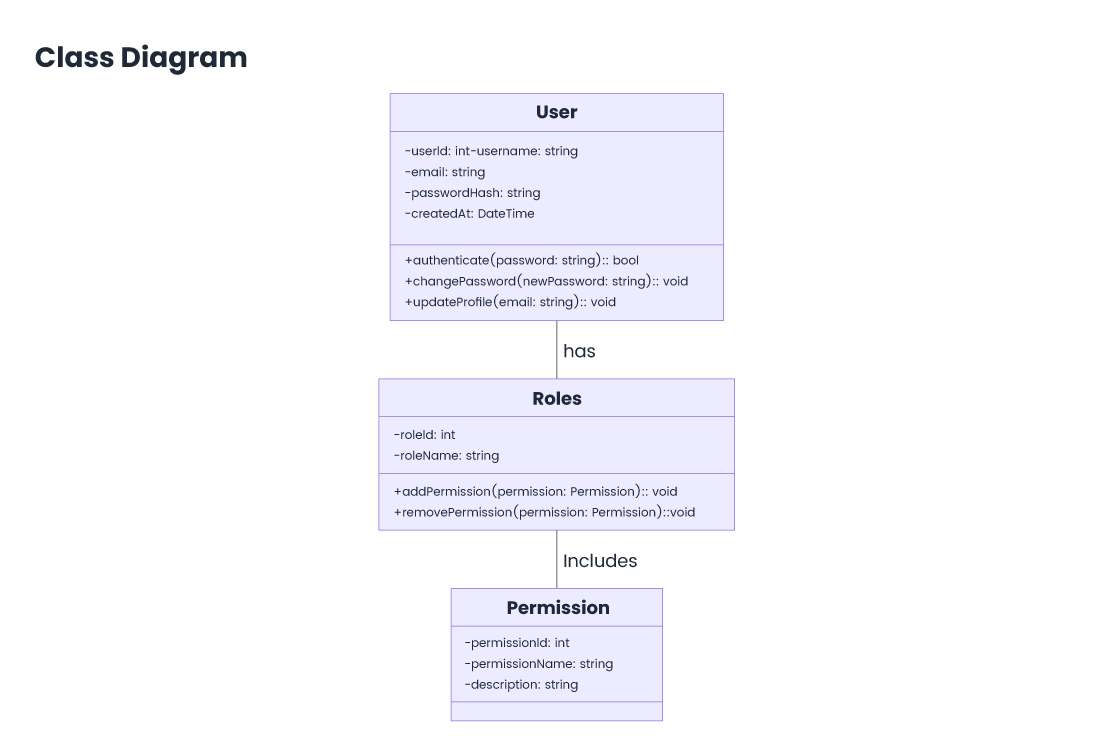
クラス図
Mermaidのクラス図は、クラス、属性、メソッド、および関係を示すことによって、システムの構造を表すために使用されます。オブジェクト指向設計に最適で、クラス階層、継承、インターフェイス、およびオブジェクト間の関連付けを視覚化するのに役立ちます。
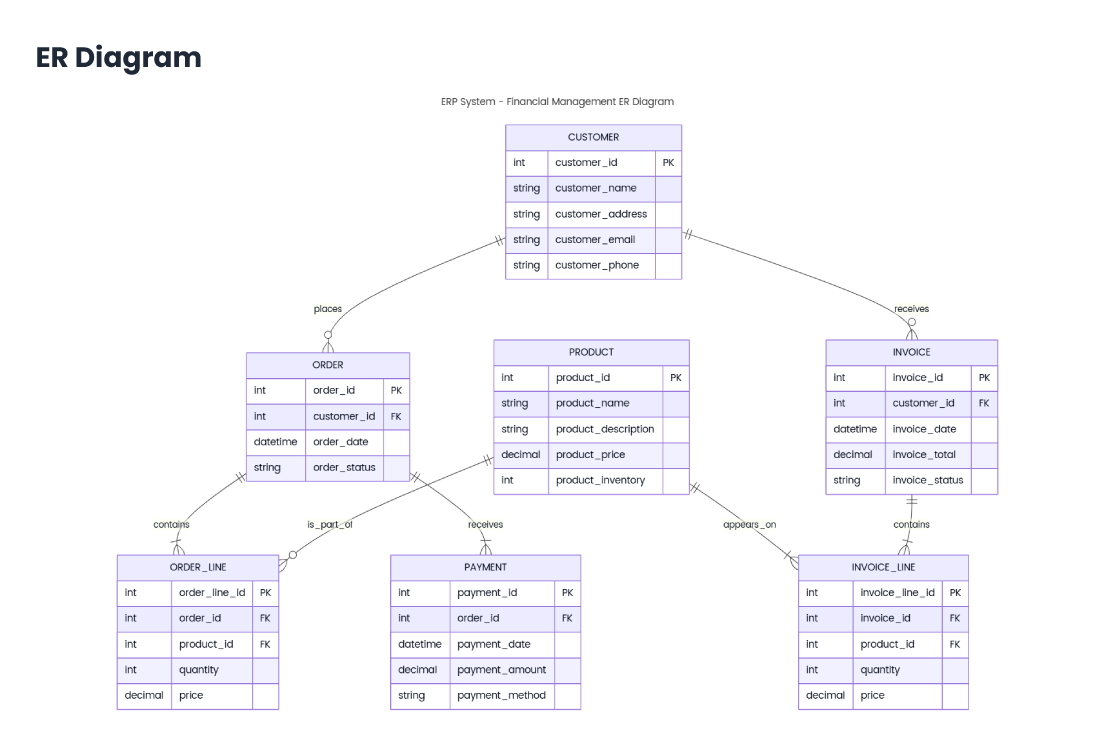
ER図
Mermaidのエンティティリレーションシップ(ER)図は、データベース内のエンティティ間の関係をモデル化するために使用されます。エンティティ、その属性、およびエンティティ間の関係(一対多、多対多など)を視覚的に表します。
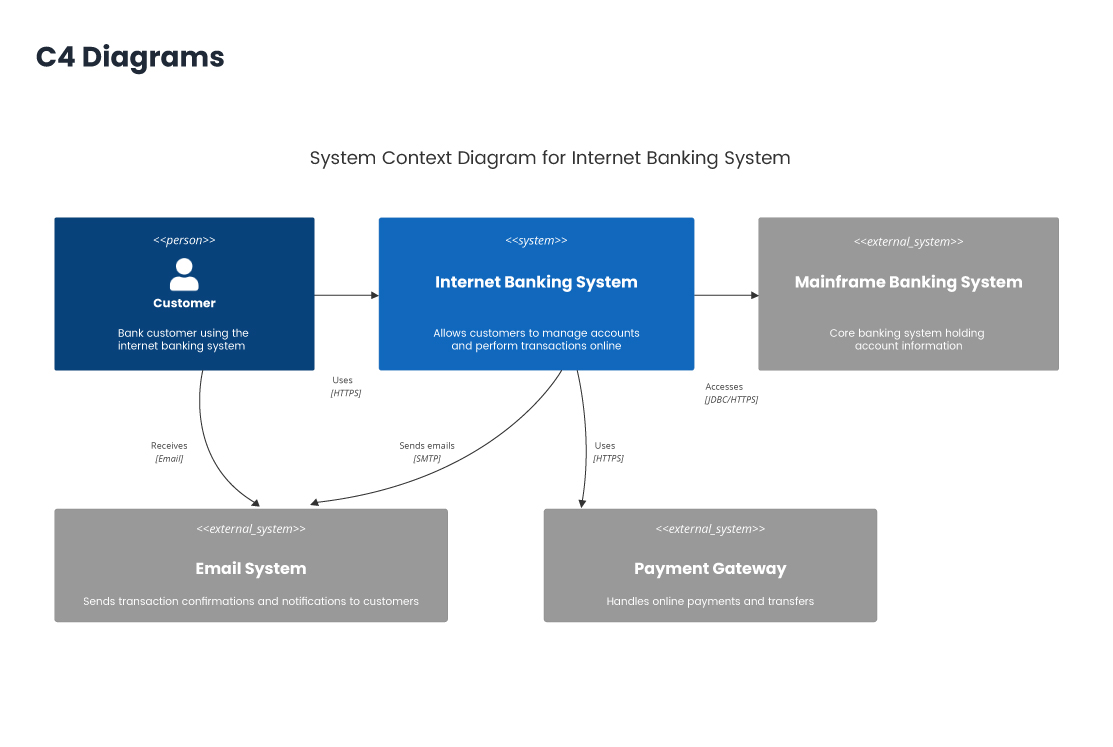
C4図
MermaidのC4図は、さまざまなレベルの抽象化でソフトウェアシステムのアーキテクチャを表すために使用されます。これらは、次の4つの主要なタイプで構成されています。 コンテキスト図 – システムとその外部インタラクションのハイレベルビュー。 コンテナ図 – システムを構成する主要なコンテナ(アプリケーションまたはデータベース)を示します。 コンポーネント図 – コンテナ内のコンポーネントを詳述します。 コード図 – クラスレベルでのコンポーネントの内部構造を示します。
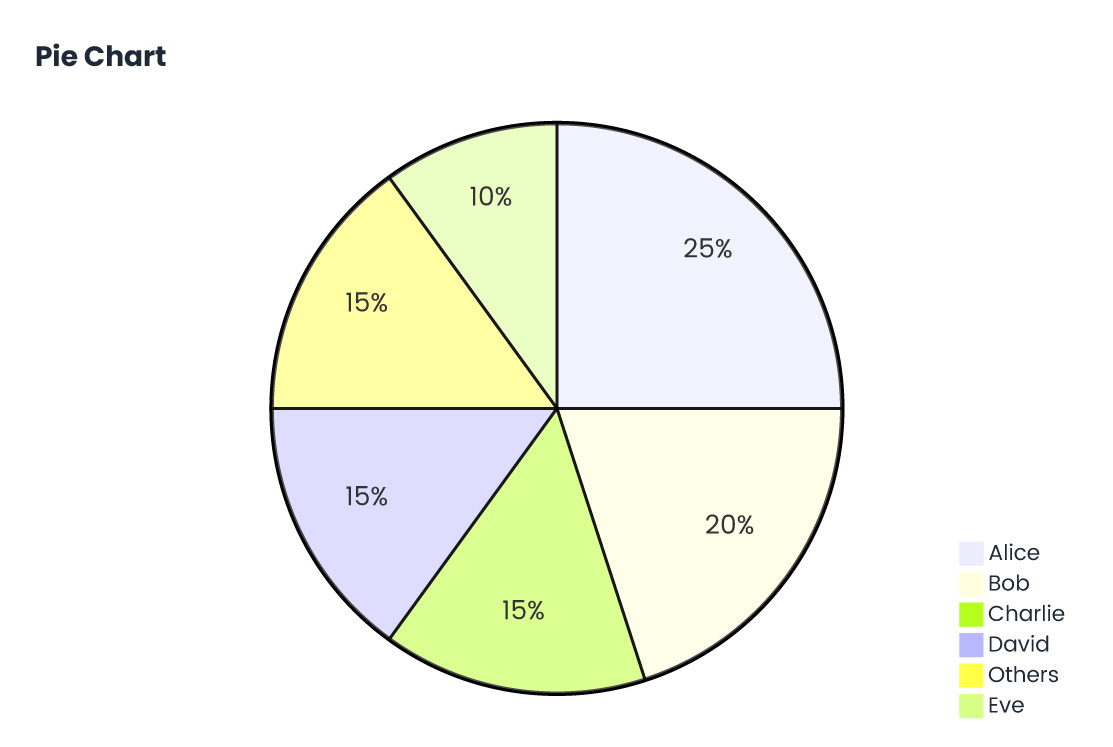
円グラフ
Mermaidの円グラフは、データを円のセグメントとして表示するために使用され、各セグメントは全体に対する割合を表します。相対的なパーセンテージまたは合計の一部を表示するのに最適です。Mermaidの円グラフ機能は単純ですが、データの分布を明確で視覚的に魅力的な形式で効果的に伝えることができます。
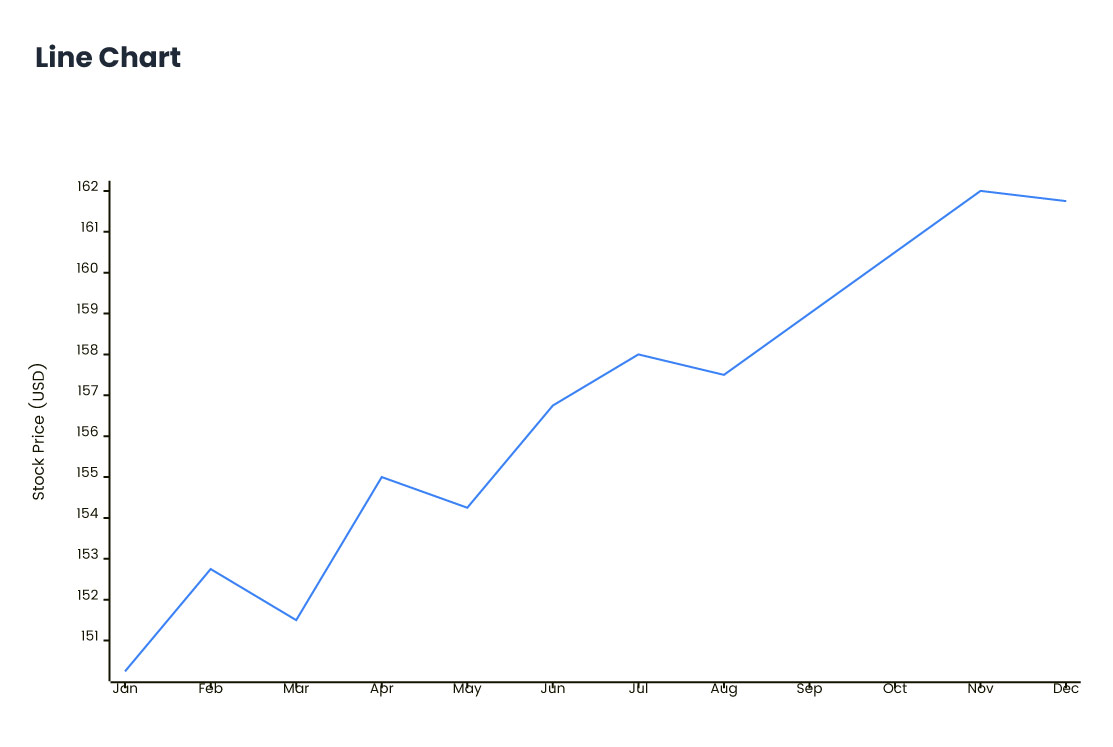
折れ線グラフ
Mermaidの折れ線グラフは、直線で接続されたデータポイントを表すために使用され、時間の経過に伴う傾向または連続データを示すのに理想的です。売上や気温など、時系列にわたる変数の変化を視覚化するためによく使用されます。Mermaidの折れ線グラフは簡単に作成できるため、進捗状況の追跡や複数のデータセットの比較に最適です。
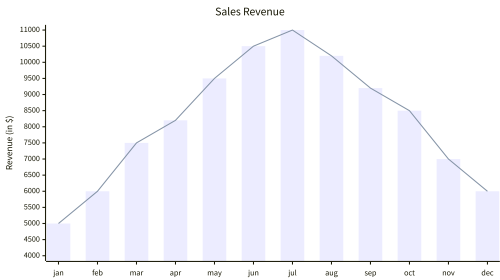
コンボ
複合グラフとも呼ばれる棒と折れ線グラフは、棒グラフと折れ線グラフを1つの可視化に組み合わせたものです。バーは通常、個別のデータカテゴリを表し、線は傾向または比較を示します。この二軸グラフは、時間経過に伴うボリュームと成長など、2つのデータセット間の関係を強調するのに最適です。
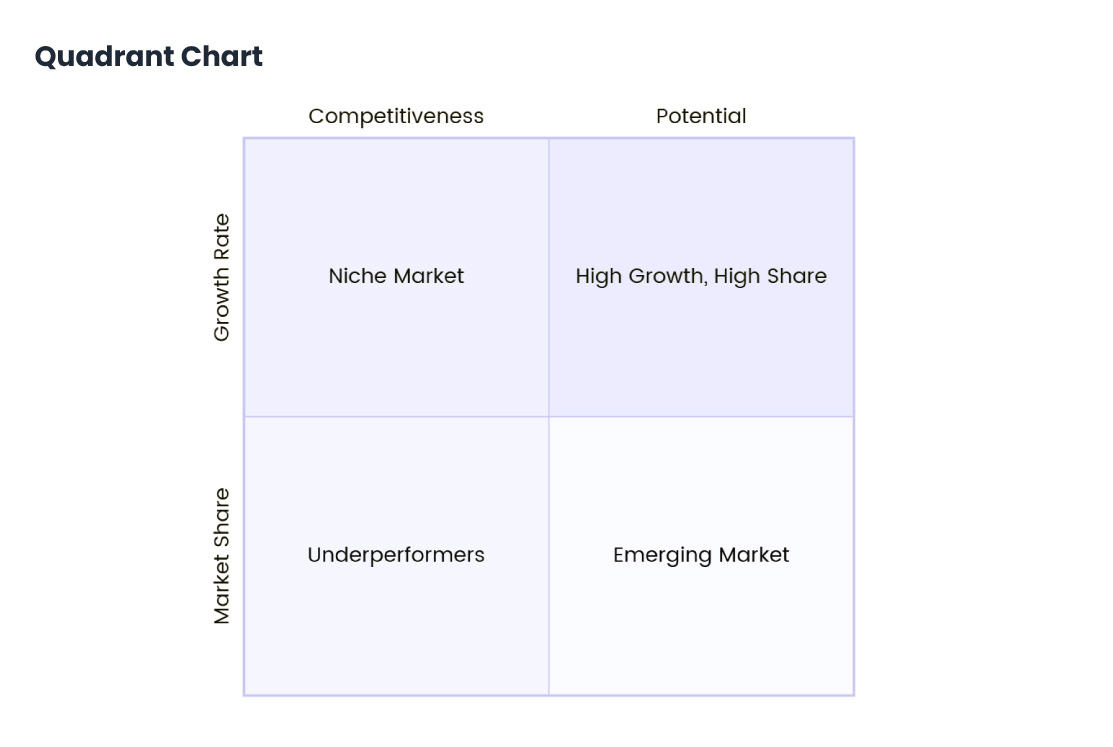
象限図
Mermaidはネイティブで象限図をサポートしていませんが、散布図を使用するか、要素のカスタムポジショニングを使用してカスタムフローチャートを使用することにより、象限図を視覚的にシミュレートできます。象限図は通常、グラフを4つのセクション(象限)に分割して2つの変数を表し、多くの場合、競争的ポジショニングやSWOT分析などに使用されます。
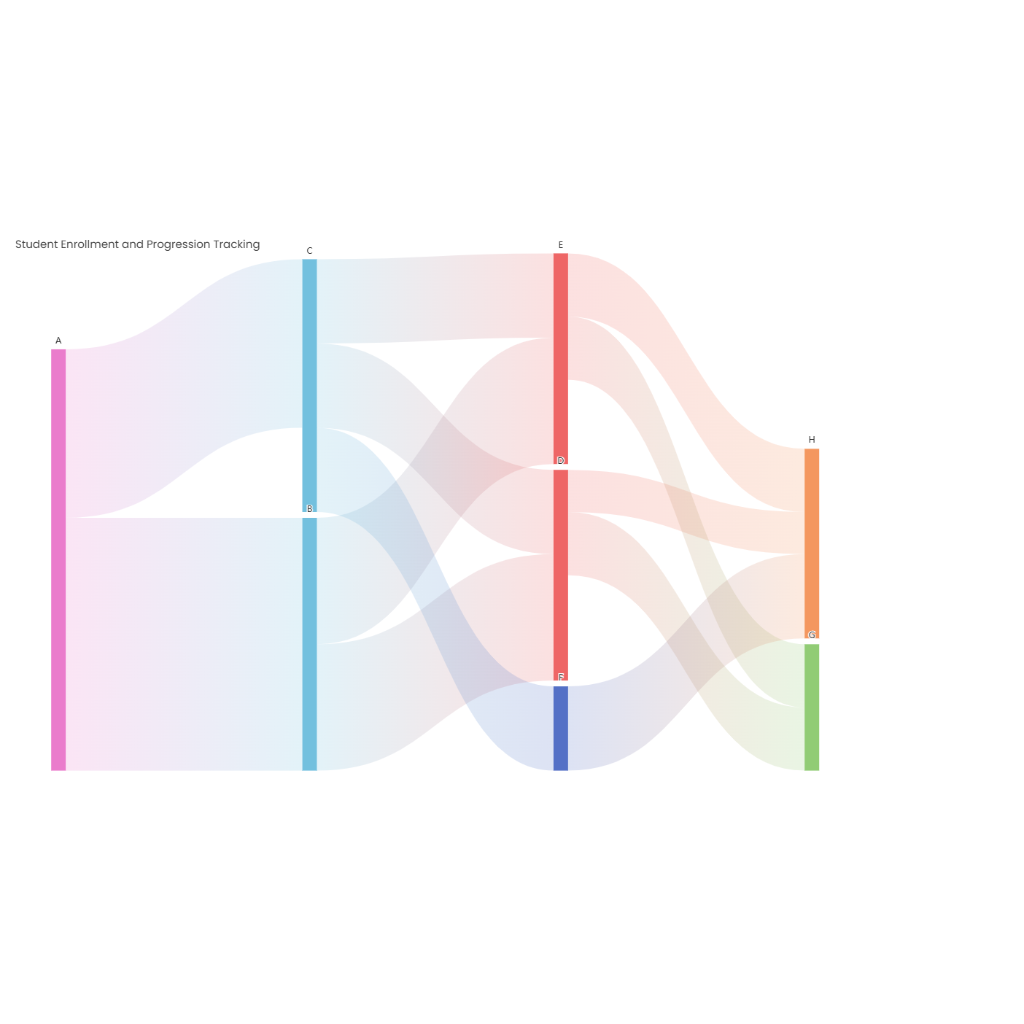
サンキー
サンキーダイアグラムは、矢印の幅がフローの量に比例するフローダイアグラムです。プロセス間のエネルギー、材料、またはコストの移動を視覚化するためによく使用され、システムの非効率性または主要なフローを強調します。
AI Mermaidチャートメーカーの機能

自動チャート作成

スマートレイアウトの最適化

複数のチャートタイプ

リアルタイムグラフの更新

シームレスなツール統合

セットアップは不要
AI Mermaidチャートメーカーの使用方法
01
データの入力
Mermaidチャートで視覚化するデータを入力します。
02
チャートタイプの選択
Mermaidチャートのタイプ(フローチャート、ガントチャートなど)を選択します。
03
AIで生成
「AIで生成」をクリックして、チャートを即座に作成します。
04
チャートのカスタマイズ
色、ラベル、デザイン要素を編集します。
05
ダウンロードと共有
Mermaidチャートを簡単にダウンロードまたは共有できます。

インスタントチャート作成
AIを使用すると、Mermaidチャートが即座に生成されます。データを入力するだけで、数秒以内にプロフェッショナルなチャートを使用できるようになり、時間と労力を節約できます。

スマート調整
AIはMermaidチャートの構造をインテリジェントに最適化します。デザインを自動的に調整し、グラフが明確で視覚的に魅力的で理解しやすいようにします。

複数のチャートタイプ
フローチャート、ガントチャート、シーケンス図など、AIツールはさまざまなMermaidチャートタイプをサポートしているため、データに最適な視覚化を選択できます。

簡単なカスタマイズ
Mermaidチャートを簡単にカスタマイズできます。色、ラベル、スタイルをニーズに合わせて変更できるため、技術的なスキルがなくてもチャートをパーソナライズできます。

シームレスな統合
AIで生成されたMermaidチャートは、GitHub、Markdownなどのプラットフォームに簡単に埋め込むことができます。このシームレスな統合により、コラボレーションのためにチャートを簡単に共有できます。

セットアップは不要
追加のセットアップは必要ありません。Mermaidチャートはブラウザで直接生成されるため、外部サーバーやソフトウェアをインストールする必要はありません。
AI Mermaidチャートメーカーに関するFAQ
01
AIを使ってMermaidチャートを生成するには?
簡潔なテキストコマンドを入力するだけで、AIツールが自動的にMermaidチャートを生成し、プロセス、タスク、システムアーキテクチャを容易に可視化し、効率的なチャートを迅速に作成できます。
02
AIを使ってMermaidチャートを生成するには?
簡潔なテキストコマンドを入力するだけで、AIツールが自動的にMermaidチャートを生成し、プロセス、タスク、システムアーキテクチャを容易に可視化し、効率的なチャートを迅速に作成できます。
03
ツールはどのような種類のMermaidチャートをサポートしていますか?
フローチャート、ガントチャート、シーケンス図、クラス図、ステートダイアグラムなど、さまざまな種類のMermaidチャートの生成をサポートしており、さまざまなニーズに対応し、包括的な可視化を提供します。
04
AIが生成したMermaidチャートを編集できますか?
はい、AIが生成したMermaidチャートは完全に編集可能であり、色、ラベル、レイアウトなどをニーズに合わせてカスタマイズできるため、チャートがプロジェクトや個人の好みに適合することを保証します。
05
AIが生成したMermaidチャートのエクスポート方法
AIが生成したMermaidチャートは、PNG、SVG、またはMermaid形式で簡単にエクスポートできるため、他のドキュメントやプラットフォームで簡単に再利用できます。プロジェクトの共有、ウェブサイトへの埋め込み、レポートへの統合など、Mermaidチャートはデータ可視化のニーズを効率的にサポートします。
06
AIが生成したMermaidチャートは、プロジェクト管理をどのように支援しますか?
AIが生成したMermaidチャート(ガントチャートやフローチャートなど)は、チームがタスクを明確に定義し、進捗状況をリアルタイムで追跡し、プロジェクト管理プロセスを合理化するのに役立ちます。Mermaidチャートを使用することで、チームはコラボレーションを促進し、プロジェクトのタイムリーな完了を保証し、意思決定を最適化し、最終的に生産性とプロジェクトの成功率を向上させることができます。
07
GitHubでMermaidチャートを使用するには?
AIが生成したMermaidチャートをGitHubのREADMEファイルに埋め込んで、プロジェクトドキュメントの可視性を高めることができます。Mermaidチャートを使用すると、プロジェクトのワークフロー、構造、データがより直感的になり、チームや開発者がプロジェクトの詳細をより良く理解し、伝達するのに役立ちます。
08
AIが生成したMermaidチャートは、どのような業界でメリットがありますか?
AIが生成したMermaidチャートは、ソフトウェア開発、プロジェクト管理、マーケティング、製品設計、教育など、さまざまな業界に適用できます。効率的なデータ可視化を提供し、ワークフロー管理、プロジェクト追跡、データ分析、意思決定を強化します。Mermaidチャートは、あらゆる業界で生産性と意思決定の質を大幅に向上させます。
09
Mermaidチャートを他のツールに統合できますか?
はい、AIが生成したMermaidチャートは、Markdown、Jira、Notionなどのツールにシームレスに統合できるため、コラボレーションと共有が容易になります。 Mermaidチャートをドキュメントやプラットフォームに埋め込むことで、複雑なデータやワークフローを簡単に提示し、効率、コミュニケーション、意思決定を向上させることができます。
10
AIはMermaidチャートの精度をどのように保証しますか?
当社のAIツールは、ユーザー入力をインテリジェントに分析し、レイアウトと構造を自動的に最適化し、生成されたMermaidチャートの精度を保証します。高度なアルゴリズムを搭載したAIチャートジェネレーターは,データとワークフローに基づいてチャートを自動的に調整し、効率的で正確な視覚的表現を保証します。
11
Mermaidチャートでカスタムスタイルを使用できますか?
はい、Mermaidチャートでカスタムスタイルを使用して、色、フォント、ノードサイズなど、外観を調整し、ニーズに合わせて完全にカスタマイズできます。AIチャートジェネレーターを使用すると、プロジェクトのスタイルとブランド要件に合わせたパーソナライズされたデザインを簡単に作成できます。
12
AIが生成したMermaidチャートを使用するには、プログラミングの知識が必要ですか?
AIが生成したMermaidチャートを使用するために、プログラミングの知識は必要ありません。 簡潔なテキストコマンドを入力するだけで、AIが見栄えの良いMermaidチャートを自動的に生成するため、あらゆるスキルレベルのユーザーが簡単に使用できます。
13
Mermaidチャートはリアルタイムで更新されますか?
はい、入力データを更新すると、AIが生成されたMermaidチャートを即座に更新し、常に最新のデータと同期して、正確な視覚的表現を保証します。
