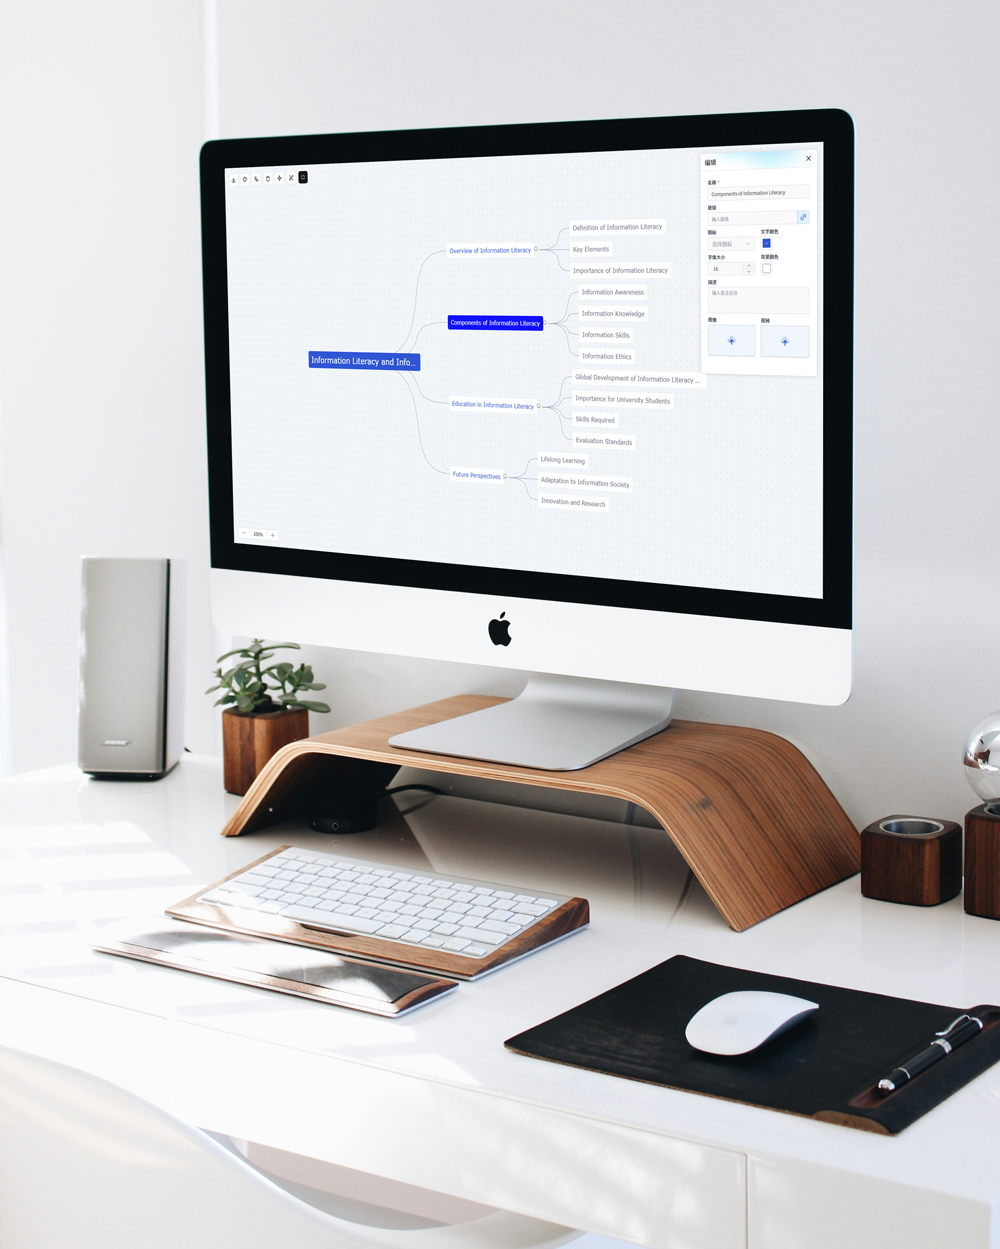
Бесплатный AI конструктор диаграмм Mermaid
Графики, сгенерированные AI Mermaid Chart Maker
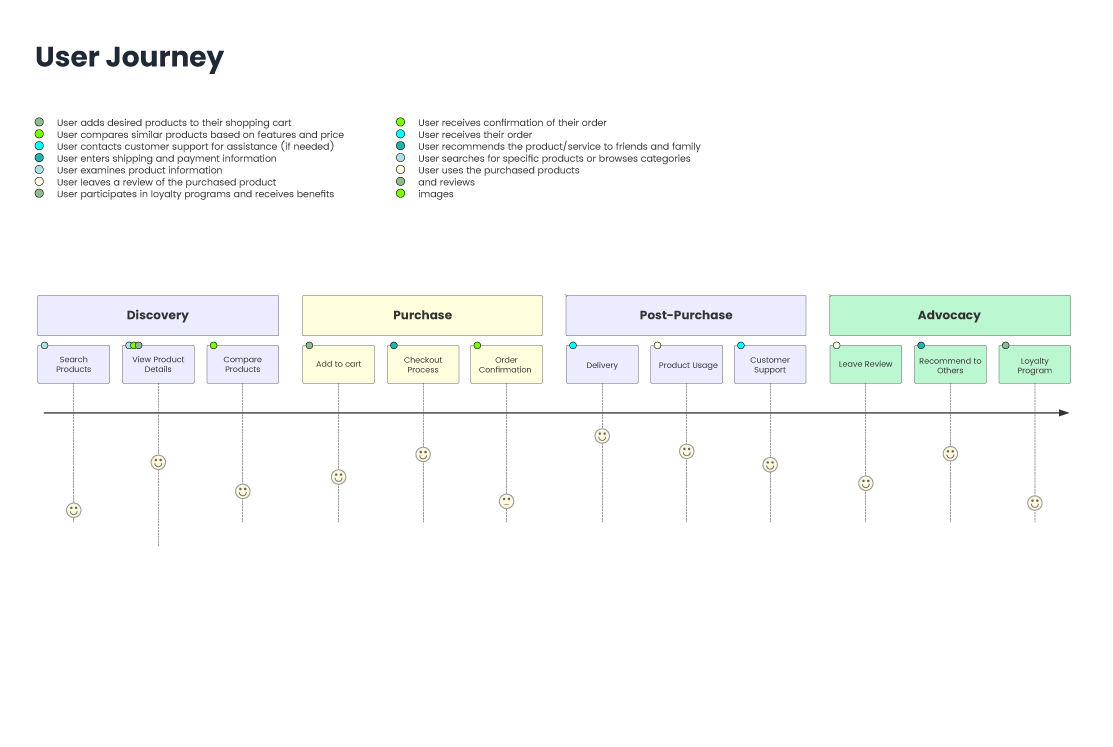
Путь пользователя
Диаграмма пути пользователя - это простой способ визуализации взаимодействия пользователя с системой шаг за шагом. Она помогает отобразить пользовательский опыт на разных этапах, действиях и эмоциях. Идеально подходит для проектирования продукта, UX-анализа или потоков адаптации, она лаконична, основана на тексте и легко интегрируется в документацию.
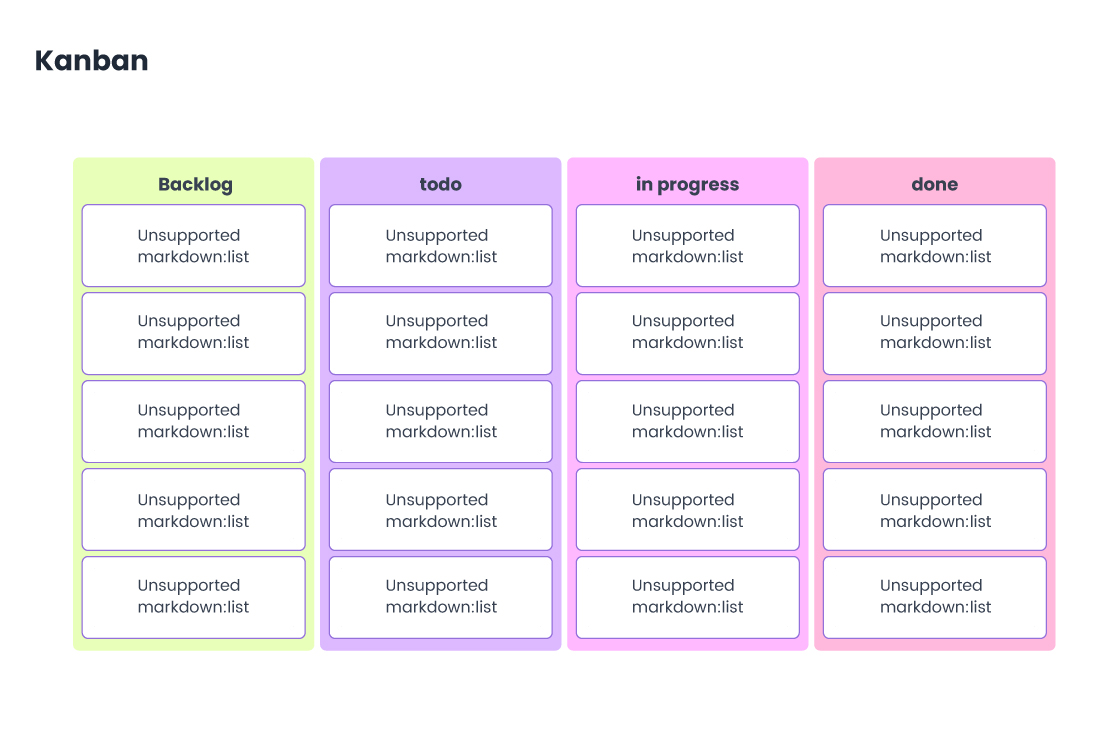
Канбан
Диаграмма Канбан используется для визуального представления рабочих процессов с использованием карточек и столбцов, имитируя традиционные Канбан-доски. Она отлично подходит для отслеживания задач на таких этапах, как «Сделать», «В процессе» и «Готово».
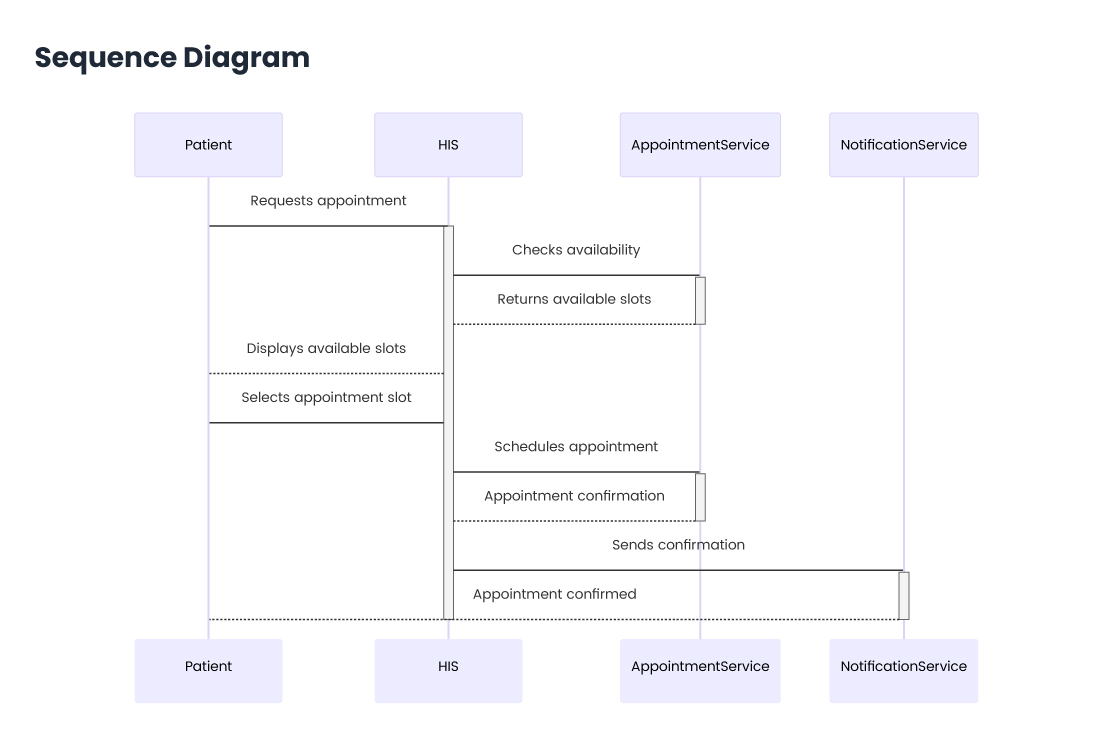
Диаграмма последовательности
Диаграмма последовательности используется для моделирования взаимодействия процессов или объектов в определенной временной последовательности. Она идеально подходит для визуализации связи между компонентами, например, вызовов API, действий пользователя или взаимодействия служб. Каждый участник показан линиями жизни, а стрелки указывают на обмен сообщениями, что делает ее отличной для понимания потока системы.
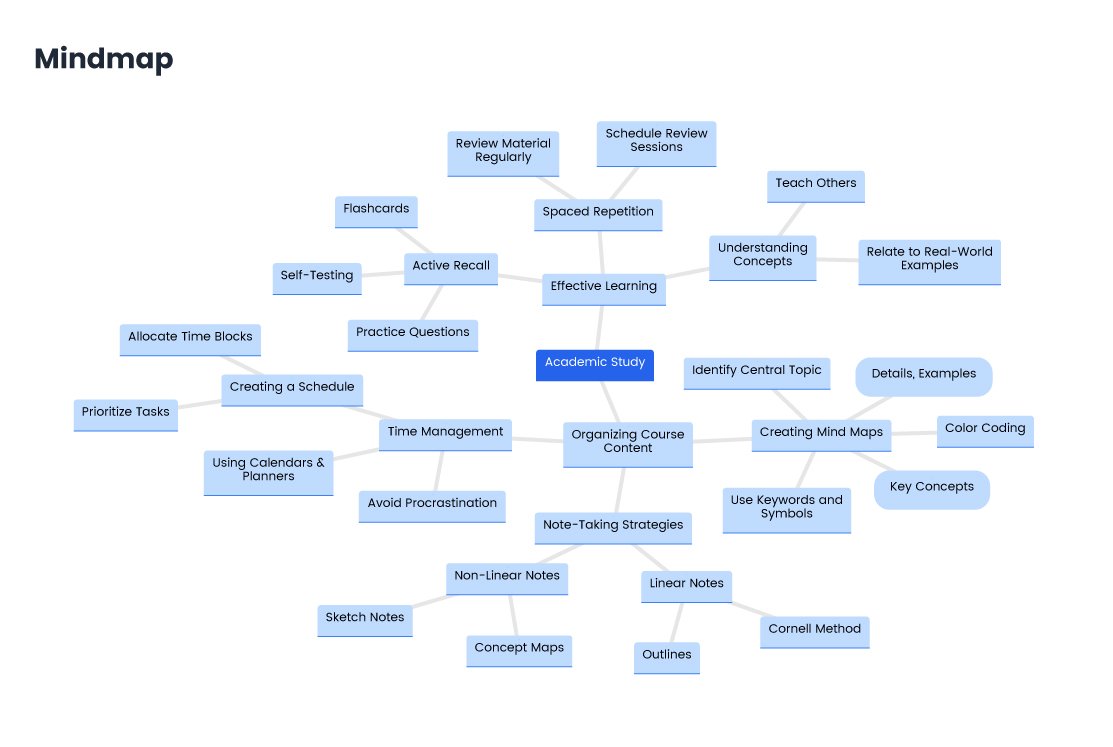
Интеллект-карта
Диаграмма интеллект-карты Mermaid позволяет визуально представлять иерархические идеи, начиная с центральной концепции и разветвляясь на связанные темы. Она идеально подходит для мозгового штурма, составления планов и структурирования знаний.
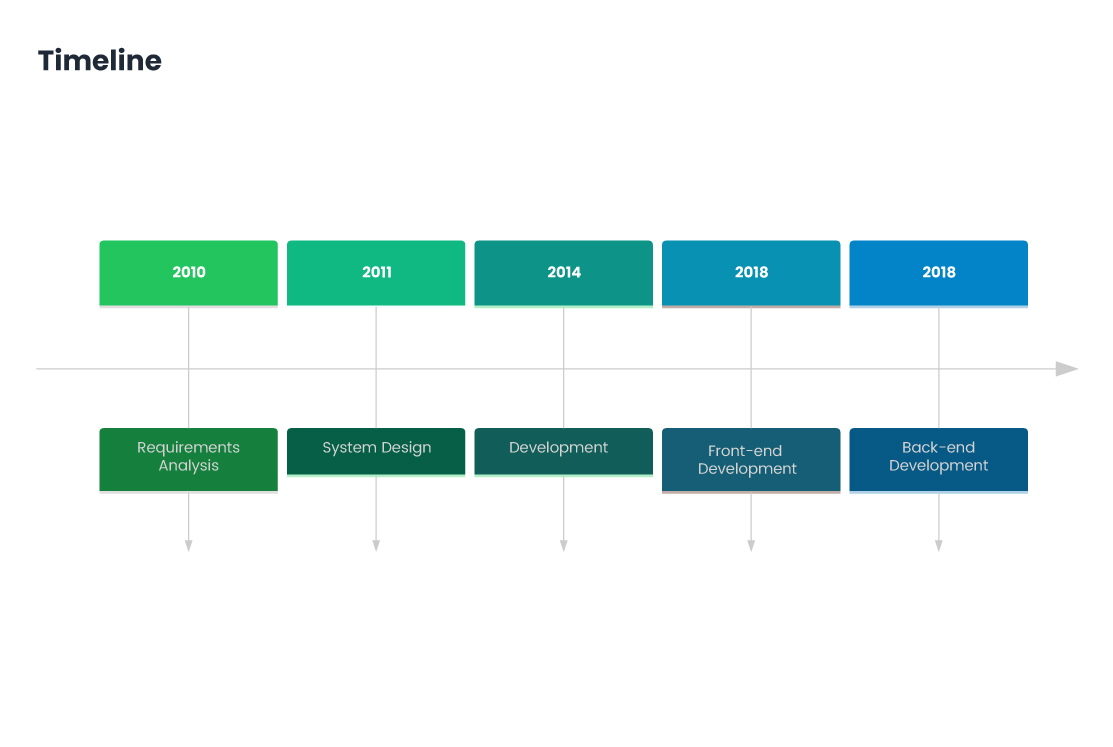
Временная шкала
Диаграмма временной шкалы Mermaid используется для визуализации событий или этапов в хронологическом порядке. Она идеально подходит для демонстрации графиков проектов, исторических событий, планов развития продукта или личных достижений.
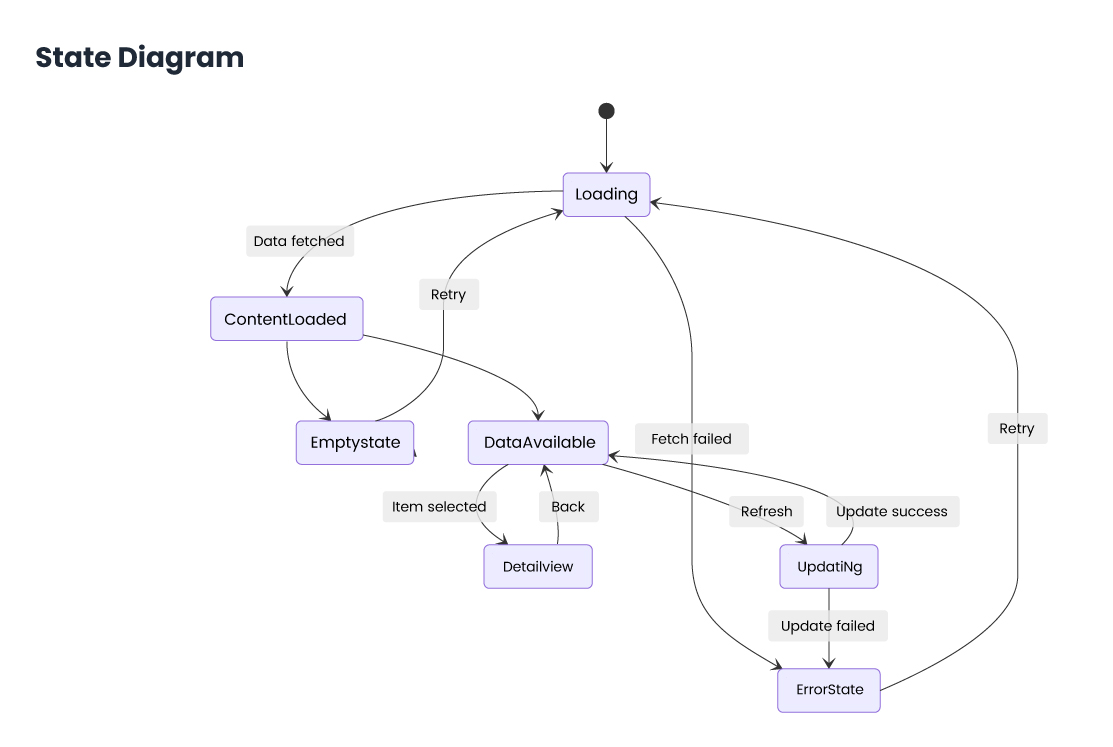
Диаграмма состояний
Диаграмма состояний Mermaid используется для представления различных состояний, в которых может находиться объект или система, и переходов между этими состояниями на основе событий или условий.
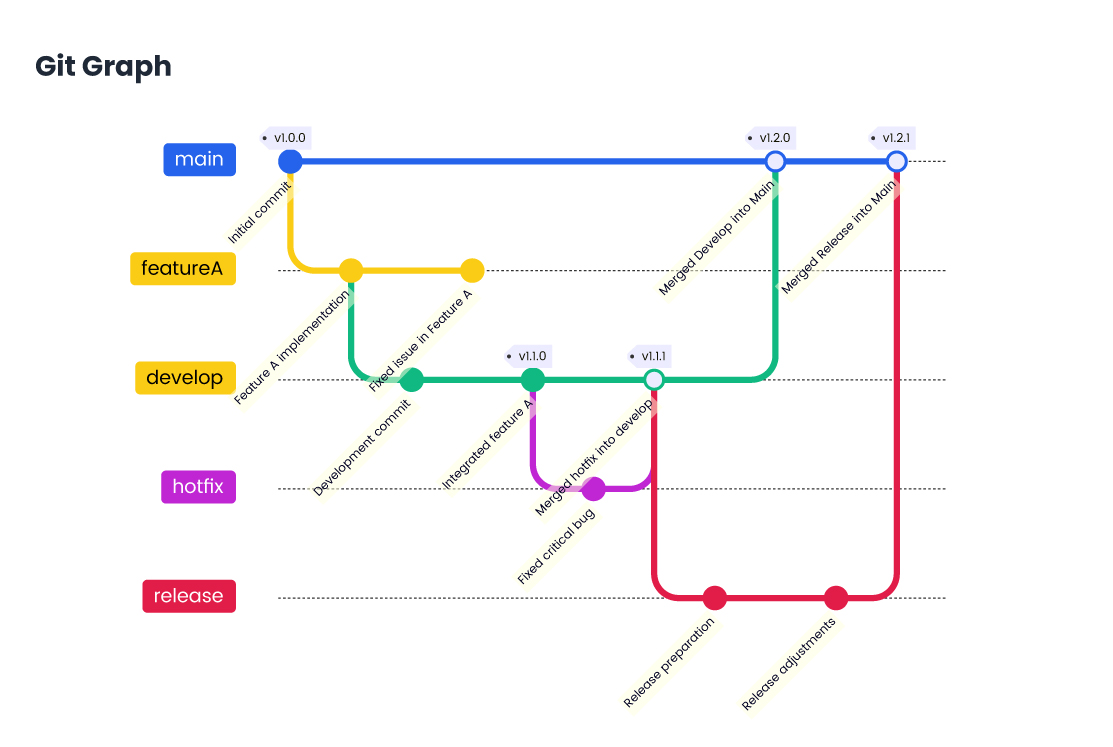
Граф Git
Диаграмма графа Git Mermaid используется для визуализации истории коммитов и структуры ветвления репозитория Git. Она показывает коммиты, ветки, слияния и отношения между ними в понятном визуальном формате. Это полезно для понимания рабочего процесса разработки, отслеживания веток функций и просмотра общей истории Git в простой и легко читаемой диаграмме.
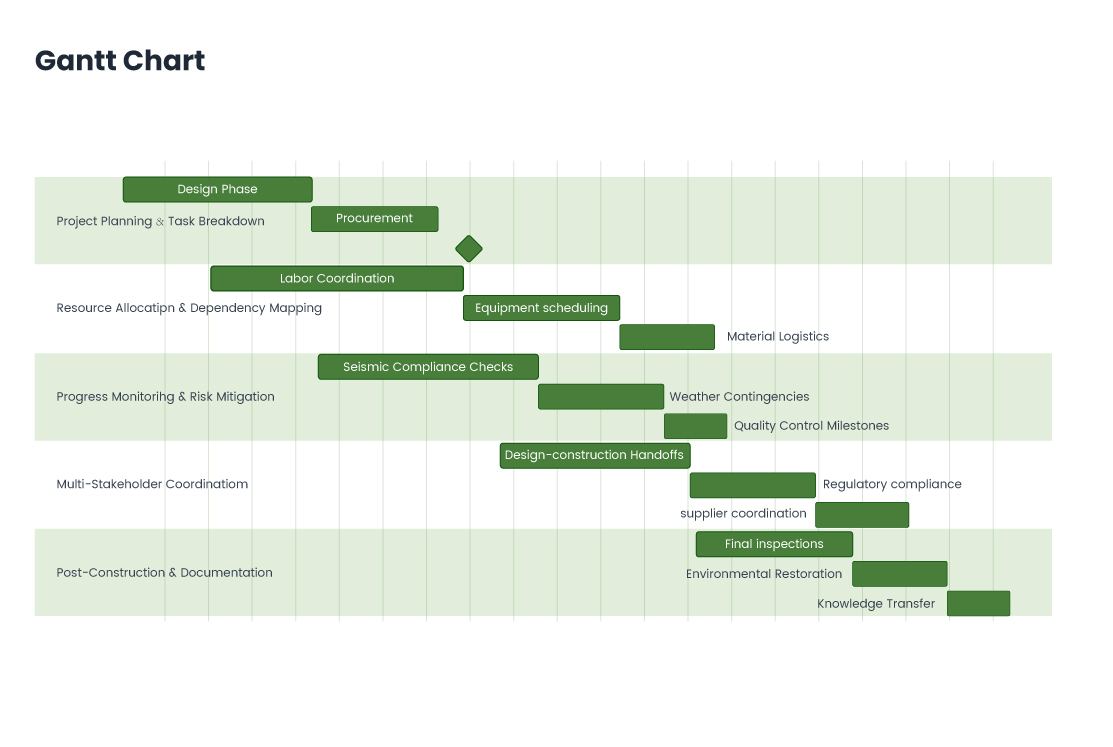
Диаграмма Ганта
Диаграмма Ганта Mermaid используется для представления графиков проектов и расписаний задач. Она наглядно отображает задачи, их продолжительность, зависимости и этапы на временной шкале.
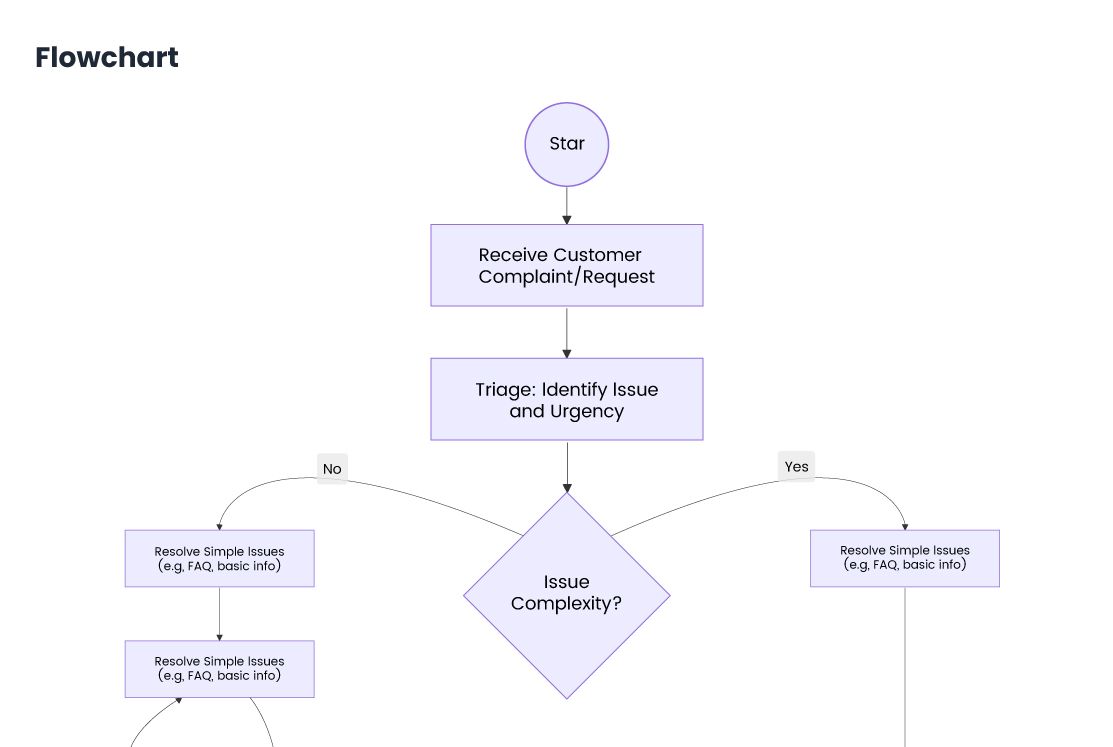
Блок-схема
Блок-схема Mermaid - это диаграмма, используемая для визуального представления процессов, рабочих процессов или этапов принятия решений. Она использует узлы (шаги или действия) и стрелки (показывающие направление потока) для отображения последовательности операций.
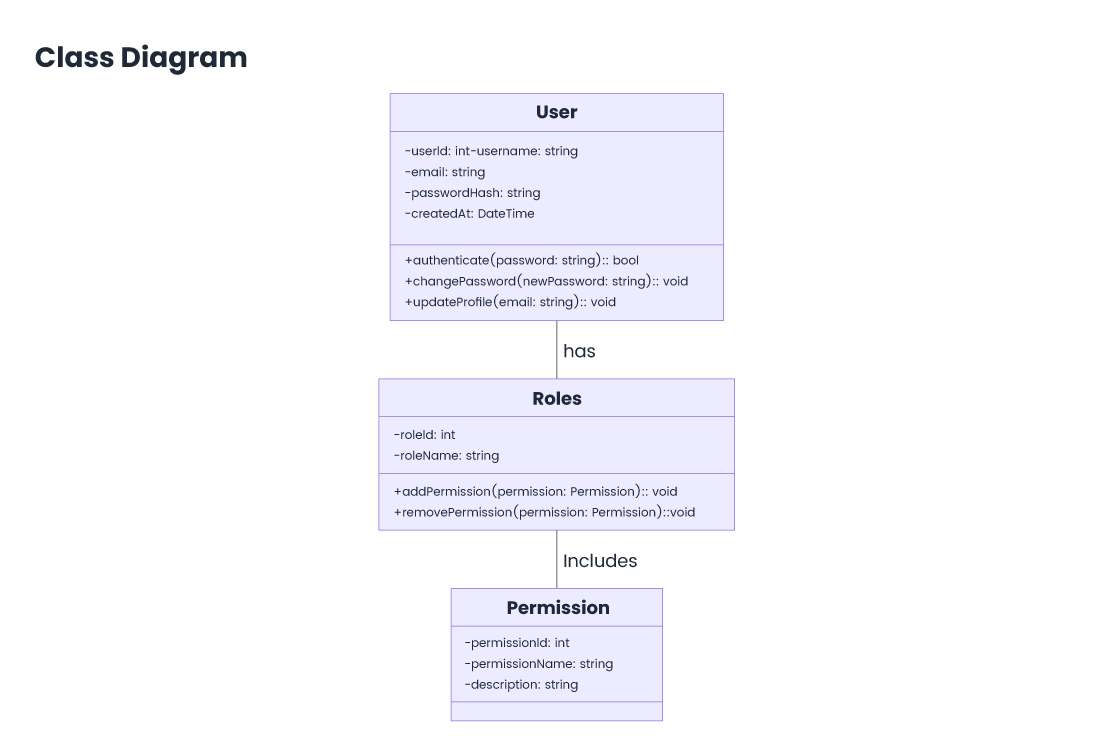
Диаграмма классов
Диаграмма классов Mermaid используется для представления структуры системы, показывая ее классы, атрибуты, методы и отношения. Она идеально подходит для объектно-ориентированного проектирования, помогая визуализировать иерархии классов, наследование, интерфейсы и ассоциации между объектами.
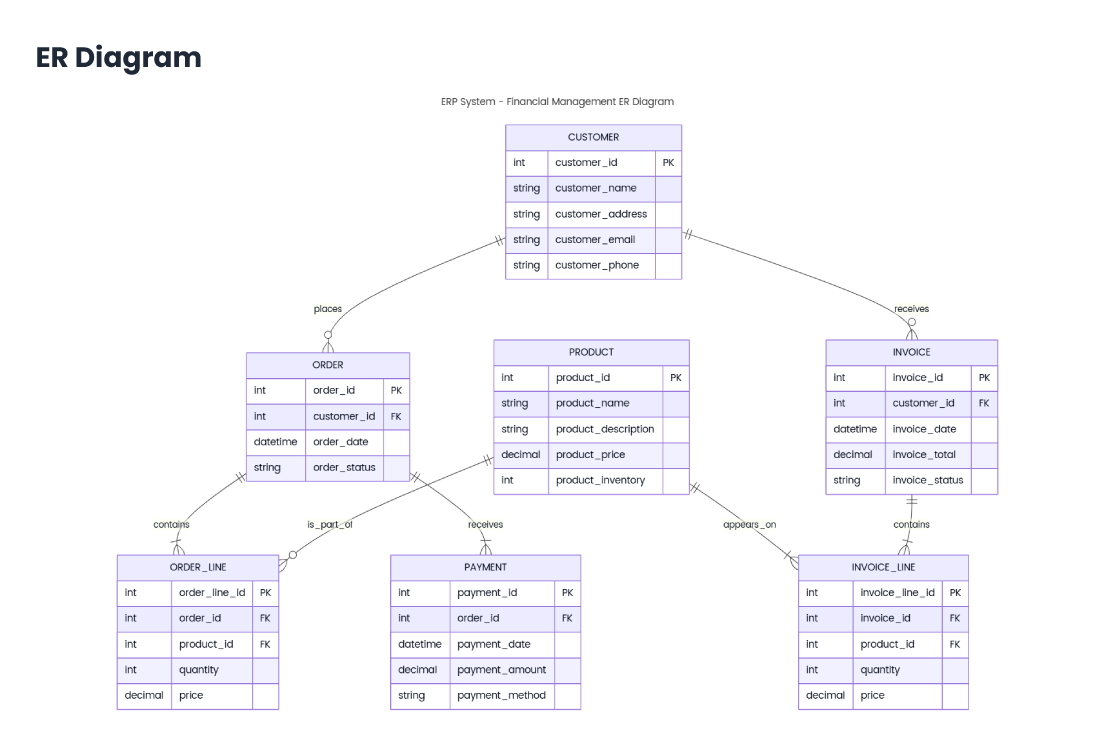
ER-диаграмма
ER-диаграмма (Entity-Relationship) Mermaid используется для моделирования отношений между сущностями в базе данных. Она визуально представляет сущности, их атрибуты и отношения между ними (например, один ко многим, многие ко многим).
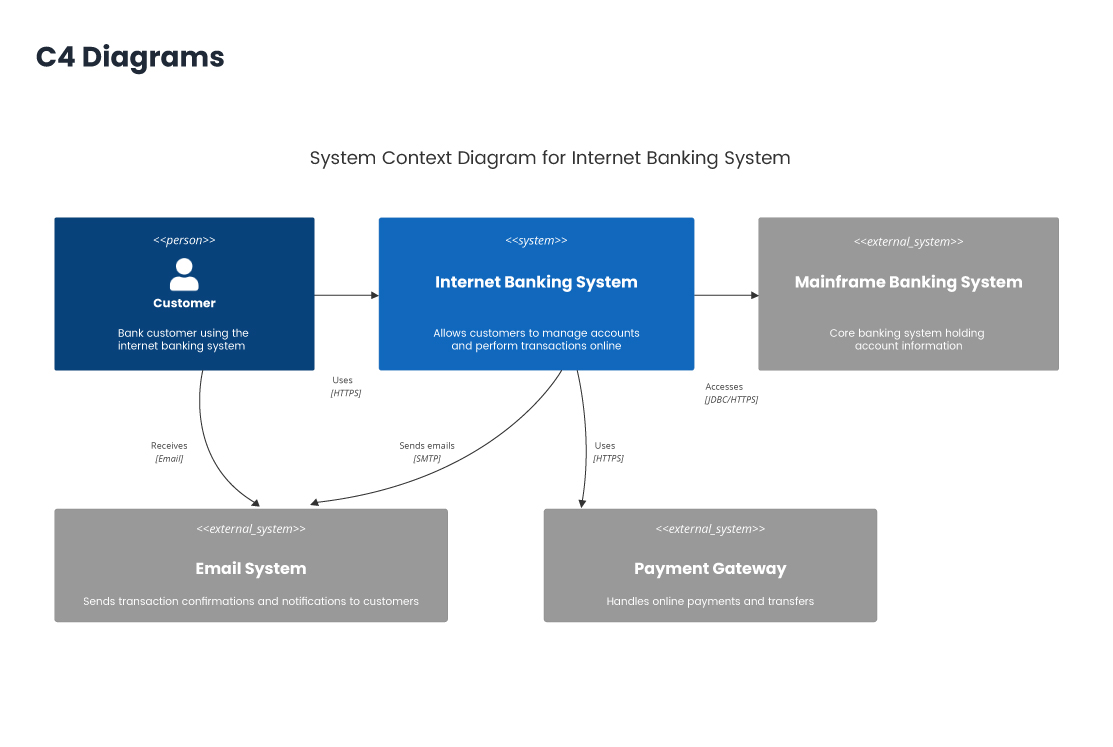
Диаграммы C4
Диаграммы C4 Mermaid используются для представления архитектуры программных систем на различных уровнях абстракции. Они состоят из четырех основных типов: Диаграмма контекста - высокоуровневый вид системы и ее внешнего взаимодействия. Диаграмма контейнеров - показывает основные контейнеры (приложения или базы данных), составляющие систему. Диаграмма компонентов - детализирует компоненты внутри контейнера. Диаграмма кода - показывает внутреннюю структуру компонентов на уровне классов.
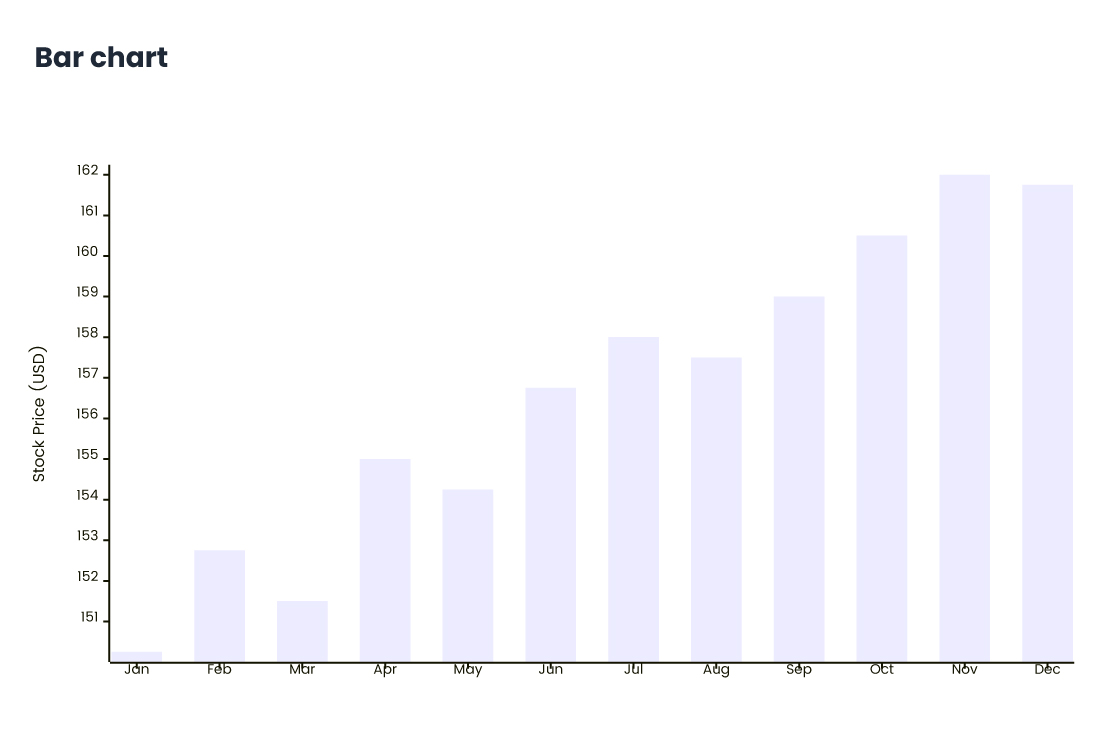
Гистограмма
Гистограмма Mermaid используется для визуализации данных в виде прямоугольных столбцов, длина каждого из которых пропорциональна представляемому им значению. Она идеально подходит для сравнения количества по разным категориям или группам.
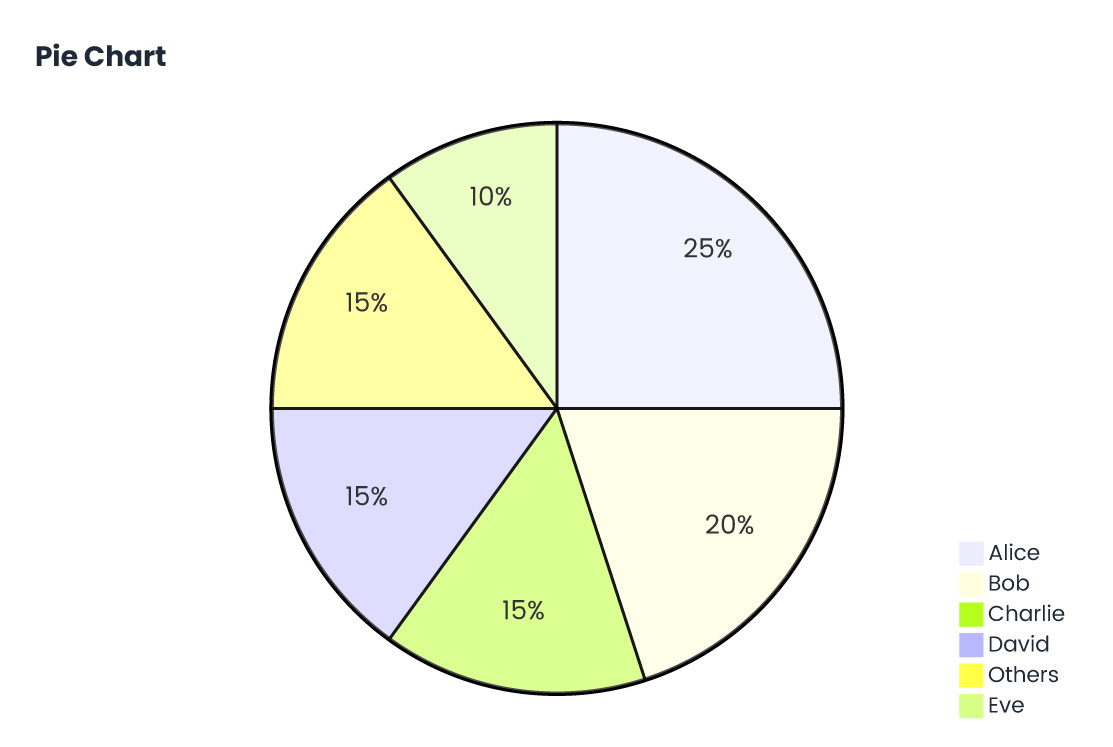
Круговая диаграмма
Круговая диаграмма Mermaid используется для отображения данных в виде сегментов круга, причем каждый сегмент представляет собой долю целого. Она идеально подходит для отображения относительных процентов или частей от общего количества. Хотя функциональность круговой диаграммы Mermaid проста, она может эффективно передавать распределение данных в понятном и визуально привлекательном формате.
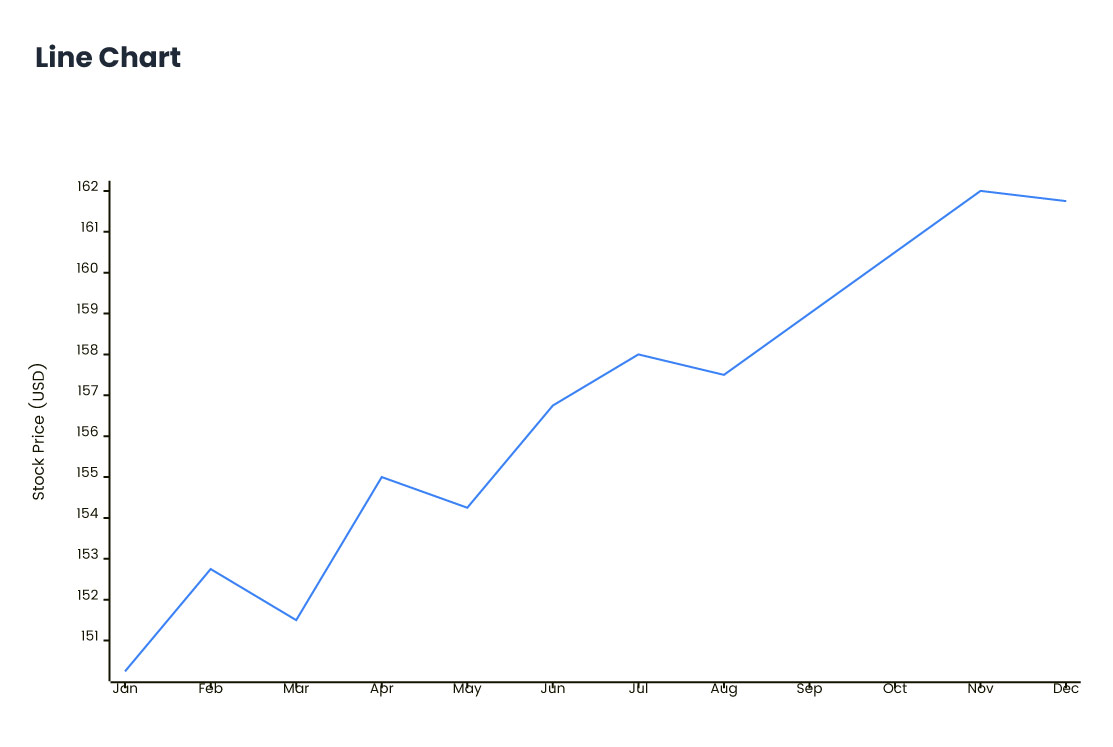
Линейный график
Линейный график Mermaid используется для представления точек данных, соединенных прямыми линиями, и идеально подходит для отображения тенденций во времени или непрерывных данных. Он обычно используется для визуализации изменений переменных, таких как продажи или температура, по временным рядам. Линейные графики Mermaid просты в создании, что делает их отличными для отслеживания прогресса или сравнения нескольких наборов данных.
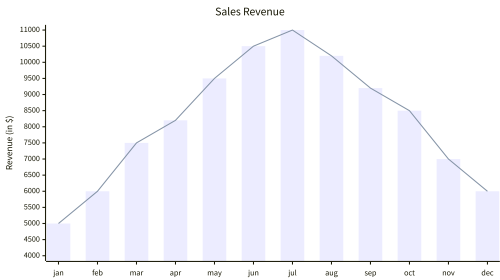
Комбинированный график
Гистограмма с линейным графиком, также известная как комбинированный график, объединяет гистограмму и линейный график в одной визуализации. Столбцы обычно представляют дискретные категории данных, а линия показывает тенденции или сравнения. Этот график с двумя осями идеально подходит для выделения связей между двумя наборами данных, такими как объем и рост с течением времени.
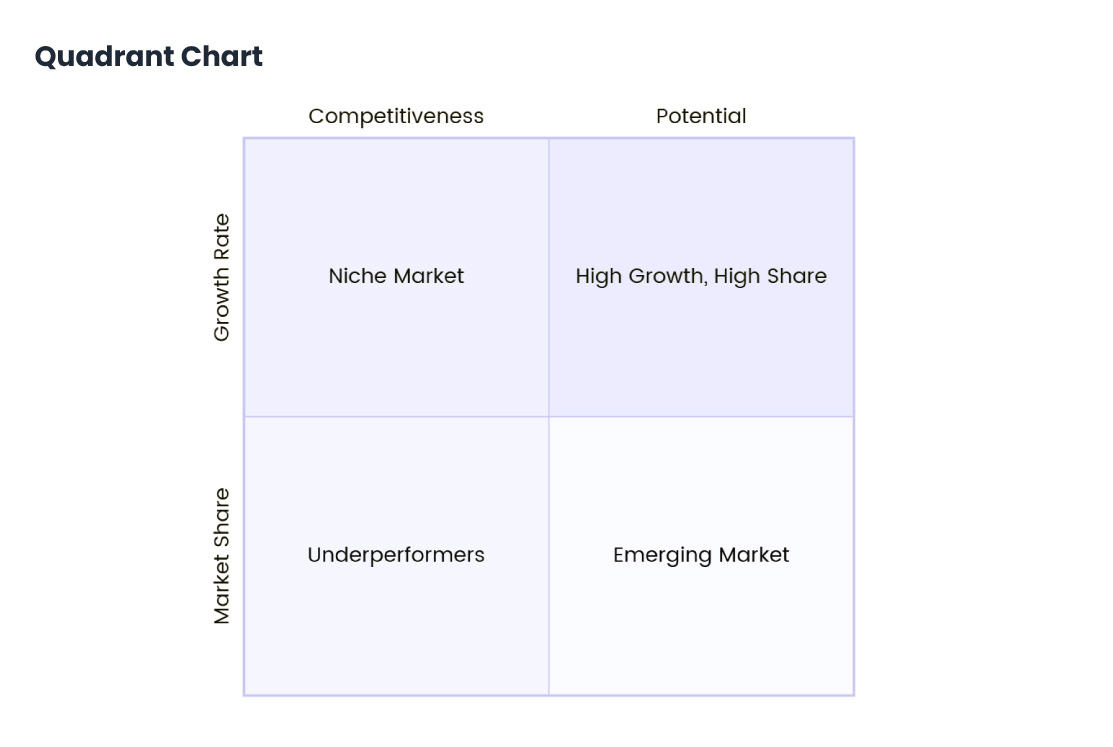
Квадрантная диаграмма
Mermaid изначально не поддерживает квадрантные диаграммы, но вы можете визуально имитировать квадрантную диаграмму, используя точечные диаграммы или пользовательские блок-схемы с пользовательским позиционированием элементов. Квадрантная диаграмма обычно делит график на четыре секции (квадранта) для представления двух переменных, часто используемых для таких вещей, как конкурентное позиционирование или SWOT-анализ.
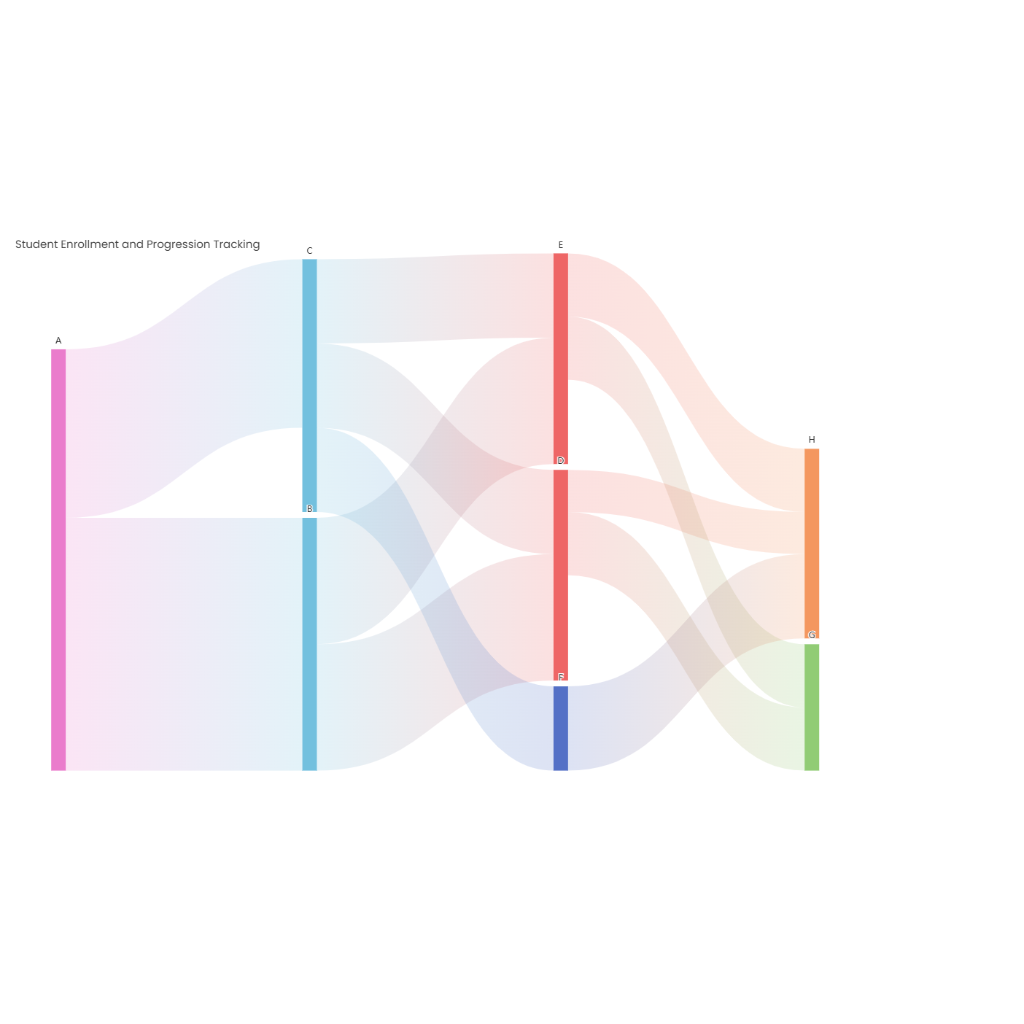
Диаграмма Санкея
Диаграмма Санкея - это диаграмма потоков, где ширина стрелок пропорциональна количеству потока. Обычно она используется для визуализации передачи энергии, материалов или затрат между процессами, выделяя неэффективность или основные потоки в системе.

Структурная схема
Структурная схема, использующая стиль блок-схемы сверху вниз (TD), визуально представляет иерархическую организацию системы. Она разбивает сложные процессы на более мелкие модули, расположенные сверху (главный модуль) вниз (подмодули). Это помогает прояснить взаимосвязи, обязанности и поток управления, что делает проектирование, понимание и отладку системы более эффективными и структурированными.
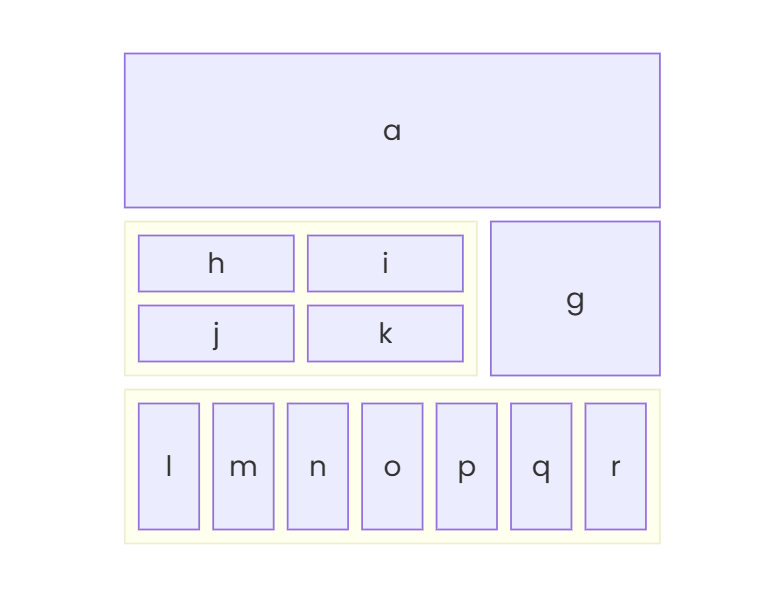
Блок-схема
Блок-схема - это упрощенное визуальное представление системы, процесса или концепции с использованием помеченных блоков, соединенных линиями. Каждый блок представляет компонент или функцию, а линии показывают отношения или поток данных. Обычно она используется в инженерии, программировании и бизнесе для четкой иллюстрации структуры и работы системы.
Особенности AI Mermaid Chart Maker

Автоматическое создание диаграмм

Интеллектуальная оптимизация макета

Несколько типов диаграмм

Обновление графиков в реальном времени

Бесшовная интеграция инструментов

Не требуется настройка
Как использовать AI Mermaid Chart Maker
01
Введите свои данные
Введите данные, которые будут визуализированы в диаграмме Mermaid.
02
Выберите тип диаграммы
Выберите тип диаграммы Mermaid (например, блок-схема, диаграмма Ганта).
03
Сгенерируйте с помощью ИИ
Нажмите «Сгенерировать с помощью ИИ», чтобы мгновенно создать диаграмму.
04
Настройте диаграмму
Измените цвета, метки и элементы дизайна.
05
Загрузите и поделитесь
Легко загрузите или поделитесь своей диаграммой Mermaid.

Моментальное создание диаграмм
С помощью ИИ диаграммы Mermaid создаются мгновенно. Просто введите свои данные, и через несколько секунд у вас будет готовая к использованию профессиональная диаграмма, что сэкономит вам время и силы.

Интеллектуальная настройка
ИИ интеллектуально оптимизирует структуру вашей диаграммы Mermaid. Он автоматически корректирует дизайн, гарантируя, что ваш график будет четким, визуально привлекательным и легким для понимания.

Множество типов диаграмм
Нужна ли вам блок-схема, диаграмма Ганта или диаграмма последовательностей, наш инструмент ИИ поддерживает различные типы диаграмм Mermaid, предоставляя вам гибкость выбора наилучшей визуализации для ваших данных.

Легкая настройка
Легко настраивайте свои диаграммы Mermaid. Изменяйте цвета, метки и стили в соответствии со своими потребностями, что позволит вам персонализировать диаграмму без каких-либо технических навыков.

Бесшовная интеграция
Сгенерированные ИИ диаграммы Mermaid можно легко встраивать в такие платформы, как GitHub, Markdown и другие. Эта бесшовная интеграция позволяет легко делиться своими диаграммами для совместной работы.

Не требуется настройка
Вам не потребуется никакой дополнительной настройки. Диаграммы Mermaid создаются непосредственно в вашем браузере, что устраняет необходимость во внешних серверах или установке программного обеспечения.
Часто задаваемые вопросы по AI Mermaid Chart Maker
01
Как мне сгенерировать диаграмму Mermaid с помощью AI?
Просто введите краткие текстовые команды, и инструмент AI автоматически сгенерирует диаграммы Mermaid, без труда визуализируя процессы, задачи или системные архитектуры, что позволит вам быстро создавать эффективные диаграммы.
02
Как мне сгенерировать диаграмму Mermaid с помощью AI?
Просто введите краткие текстовые команды, и инструмент AI автоматически сгенерирует диаграммы Mermaid, без труда визуализируя процессы, задачи или системные архитектуры, что позволит вам быстро создавать эффективные диаграммы.
03
Какие типы диаграмм Mermaid поддерживает инструмент?
Наш инструмент поддерживает создание различных типов диаграмм Mermaid, включая блок-схемы, диаграммы Ганта, диаграммы последовательностей, диаграммы классов, диаграммы состояний и многое другое, удовлетворяя различные потребности и обеспечивая всестороннюю поддержку визуализации.
04
Могу ли я редактировать диаграмму Mermaid, сгенерированную AI?
Да, диаграммы Mermaid, сгенерированные AI, полностью редактируются, что позволяет вам настраивать цвета, метки, макеты и многое другое в соответствии с вашими потребностями, гарантируя, что диаграмма соответствует вашему проекту или личным предпочтениям.
05
Как экспортировать диаграммы Mermaid, сгенерированные AI?
Диаграммы Mermaid, сгенерированные AI, можно легко экспортировать в формате PNG, SVG или Mermaid, что упрощает их повторное использование в других документах или на платформах. Будь то для обмена проектами, встраивания на веб-сайты или интеграции в отчеты, диаграммы Mermaid эффективно поддерживают ваши потребности в визуализации данных.
06
Как сгенерированная AI диаграмма Mermaid помогает в управлении проектами?
Диаграммы Mermaid, сгенерированные AI, такие как диаграммы Ганта и блок-схемы, помогают командам четко определять задачи, отслеживать прогресс в режиме реального времени и оптимизировать процессы управления проектами. С помощью диаграмм Mermaid команды могут укрепить сотрудничество, обеспечить своевременное завершение проектов и оптимизировать принятие решений, что в конечном итоге повышает производительность и показатели успеха проектов.
07
Как использовать диаграммы Mermaid на GitHub?
Вы можете встраивать диаграммы Mermaid, сгенерированные AI, в файлы README вашего GitHub, чтобы улучшить визуализацию документации вашего проекта. С помощью диаграмм Mermaid рабочие процессы, структуры и данные проекта становятся более интуитивно понятными, помогая командам и разработчикам лучше понимать детали проекта и общаться.
08
Какие отрасли могут выиграть от диаграмм Mermaid, сгенерированных AI?
Диаграммы Mermaid, сгенерированные AI, применимы в различных отраслях, включая разработку программного обеспечения, управление проектами, маркетинг, дизайн продукта и образование. Они обеспечивают эффективную поддержку визуализации данных, улучшая управление рабочим процессом, отслеживание проектов, анализ данных и принятие решений. Диаграммы Mermaid значительно повышают производительность и качество принятия решений в любой отрасли.
09
Могу ли я интегрировать диаграммы Mermaid в другие инструменты?
Да, диаграммы Mermaid, сгенерированные AI, можно легко интегрировать в такие инструменты, как Markdown, Jira и Notion, что упрощает сотрудничество и обмен данными. Встраивая диаграммы Mermaid в документы или на платформы, вы можете без труда представлять сложные данные и рабочие процессы, повышая эффективность, коммуникацию и принятие решений.
10
Как AI обеспечивает точность диаграммы Mermaid?
Наш инструмент AI интеллектуально анализирует ввод пользователя и автоматически оптимизирует макет и структуру, обеспечивая точность сгенерированных диаграмм Mermaid. Благодаря передовым алгоритмам генератор диаграмм AI автоматически корректирует диаграмму на основе данных и рабочих процессов, обеспечивая эффективное и точное визуальное представление.
11
Могу ли я использовать пользовательские стили в своей диаграмме Mermaid?
Да, вы можете использовать пользовательские стили в диаграммах Mermaid для настройки внешнего вида, включая цвета, шрифты, размеры узлов и многое другое, полностью адаптированные к вашим потребностям. С помощью генератора диаграмм AI вы можете легко создавать персонализированные дизайны, соответствующие стилю вашего проекта и требованиям к брендингу.
12
Нужны ли мне знания программирования для использования диаграмм Mermaid, сгенерированных AI?
Для использования диаграмм Mermaid, сгенерированных AI, не требуются знания программирования. Просто введите краткие текстовые команды, и AI автоматически сгенерирует красивые диаграммы Mermaid, что упрощает использование для пользователей с любым уровнем квалификации.
13
Обновляются ли диаграммы Mermaid в режиме реального времени?
Да, вы можете обновить входные данные, и AI мгновенно обновит сгенерированные диаграммы Mermaid, гарантируя, что они всегда синхронизированы с последними данными для точного визуального представления.
