AI Report Infographic Generator
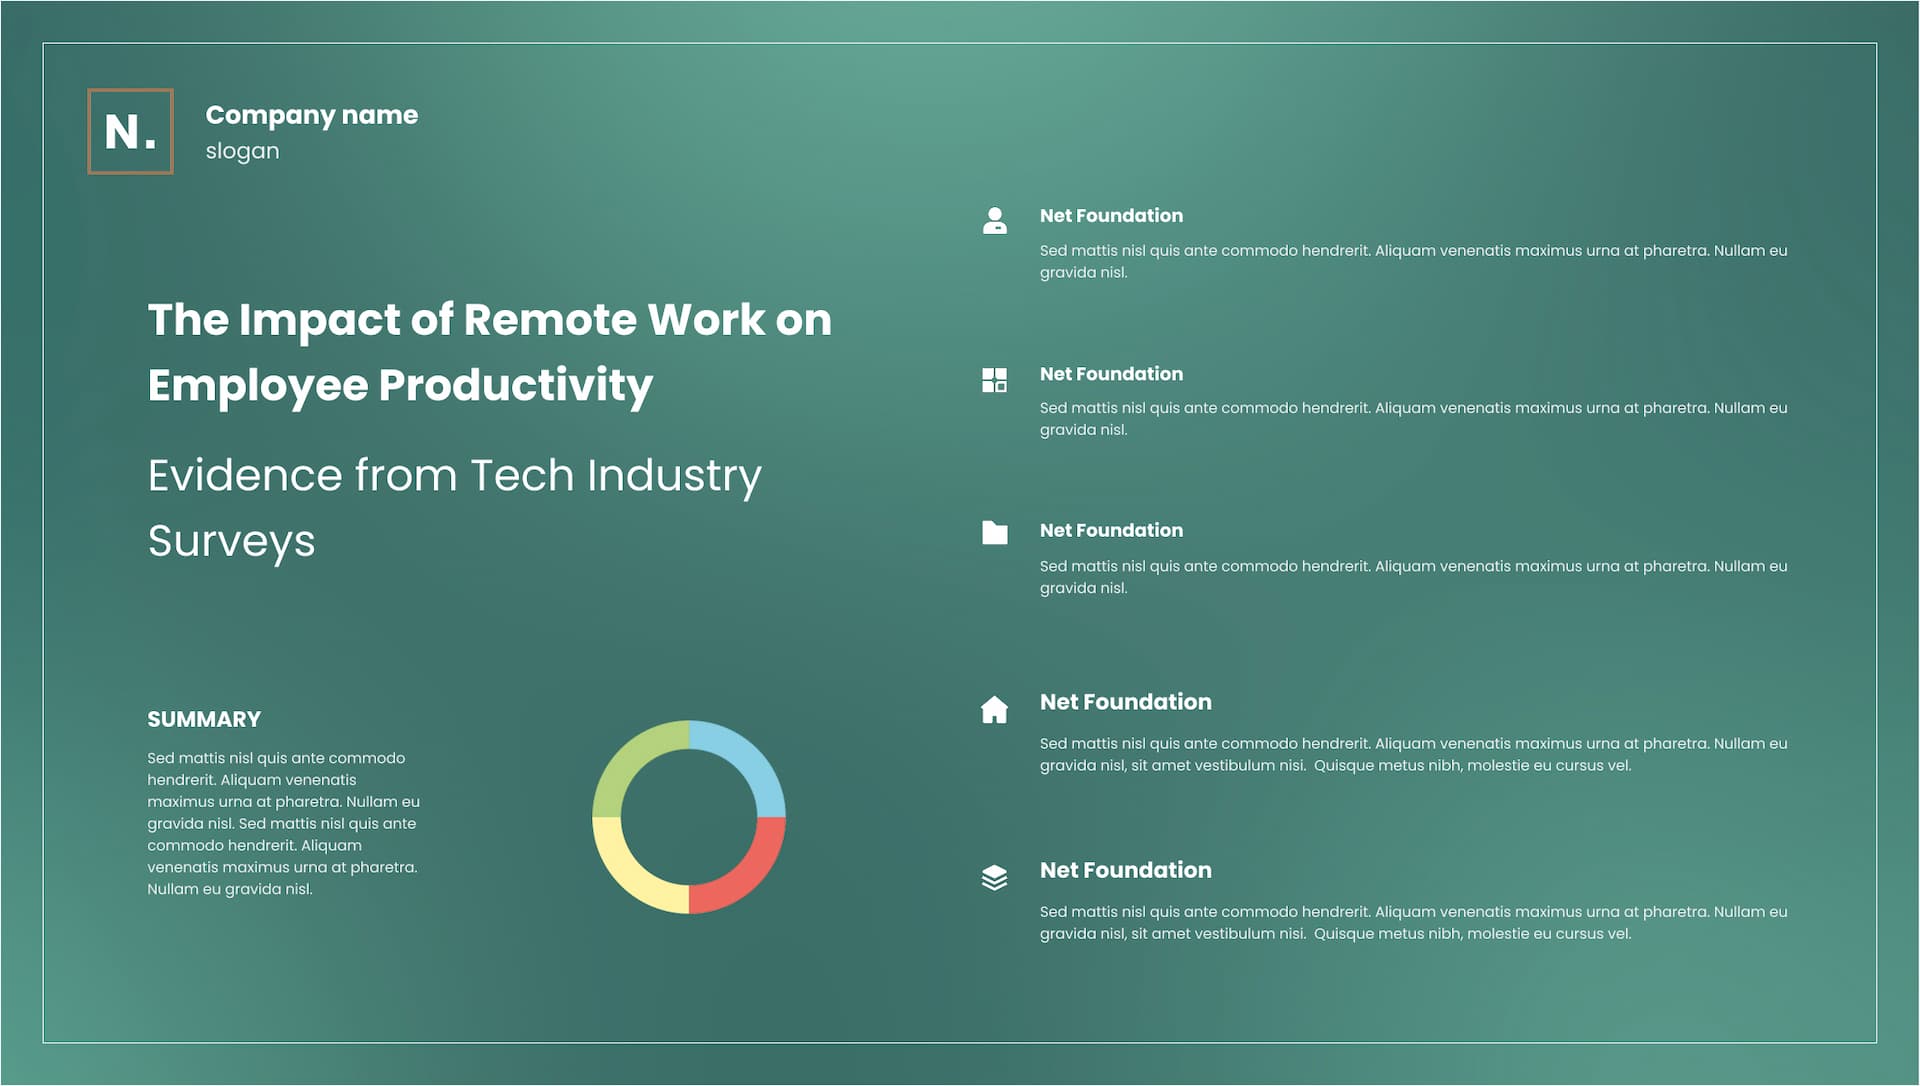
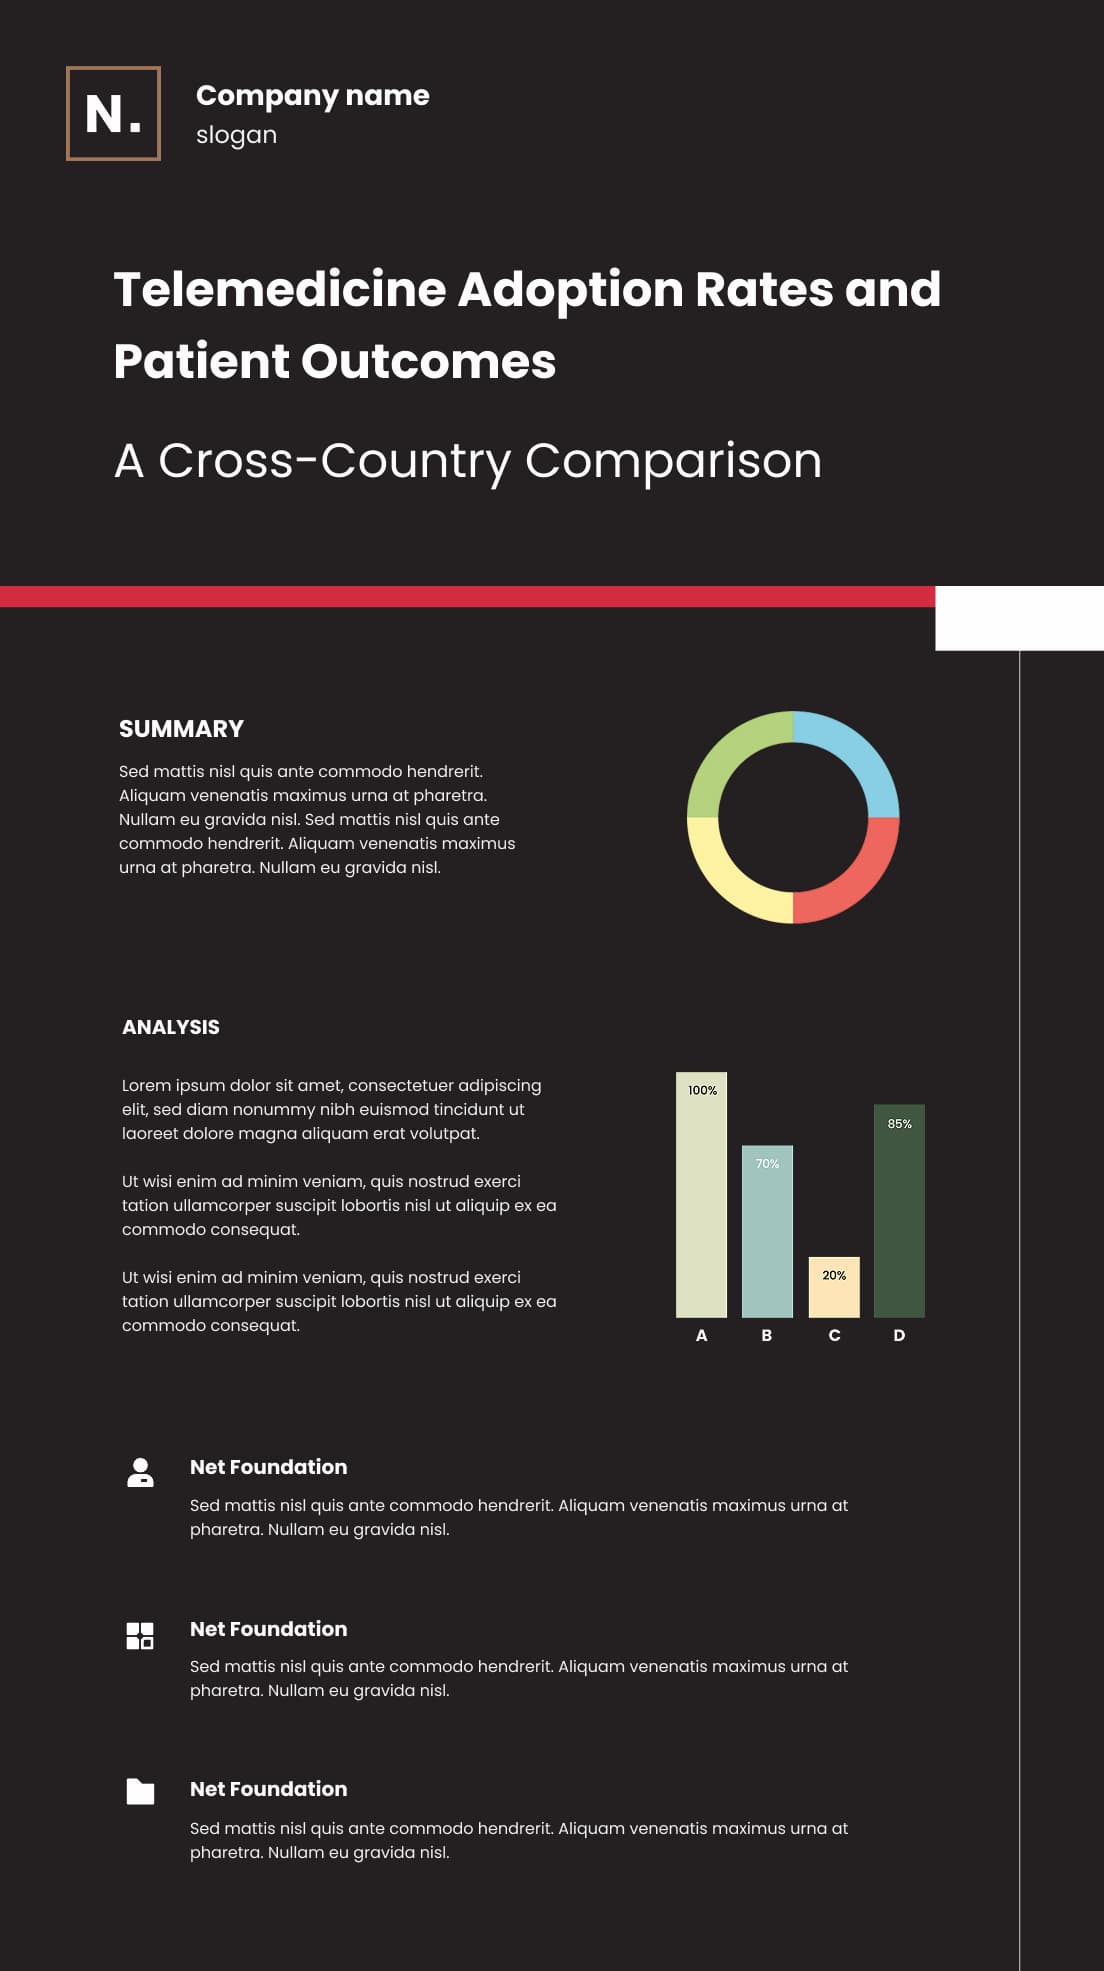
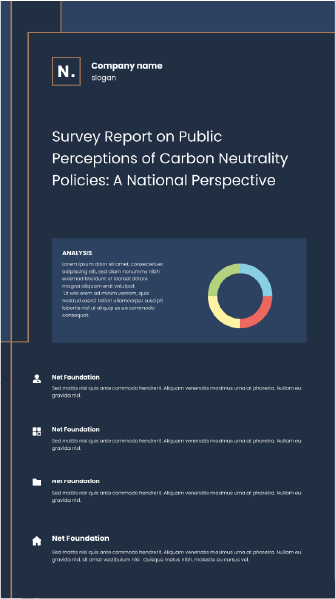
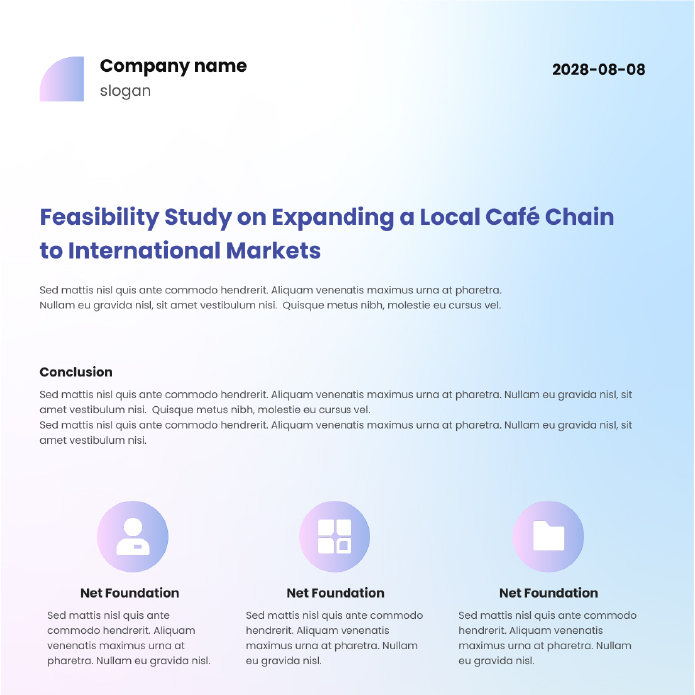
Ready-to-Use Report Templates
Auto Style Matching
Infographic for Fruits
Infographic for Pets
Square Size Infographic
Project Management Infographic
Powerful Features of the AI Report Infographic Generator
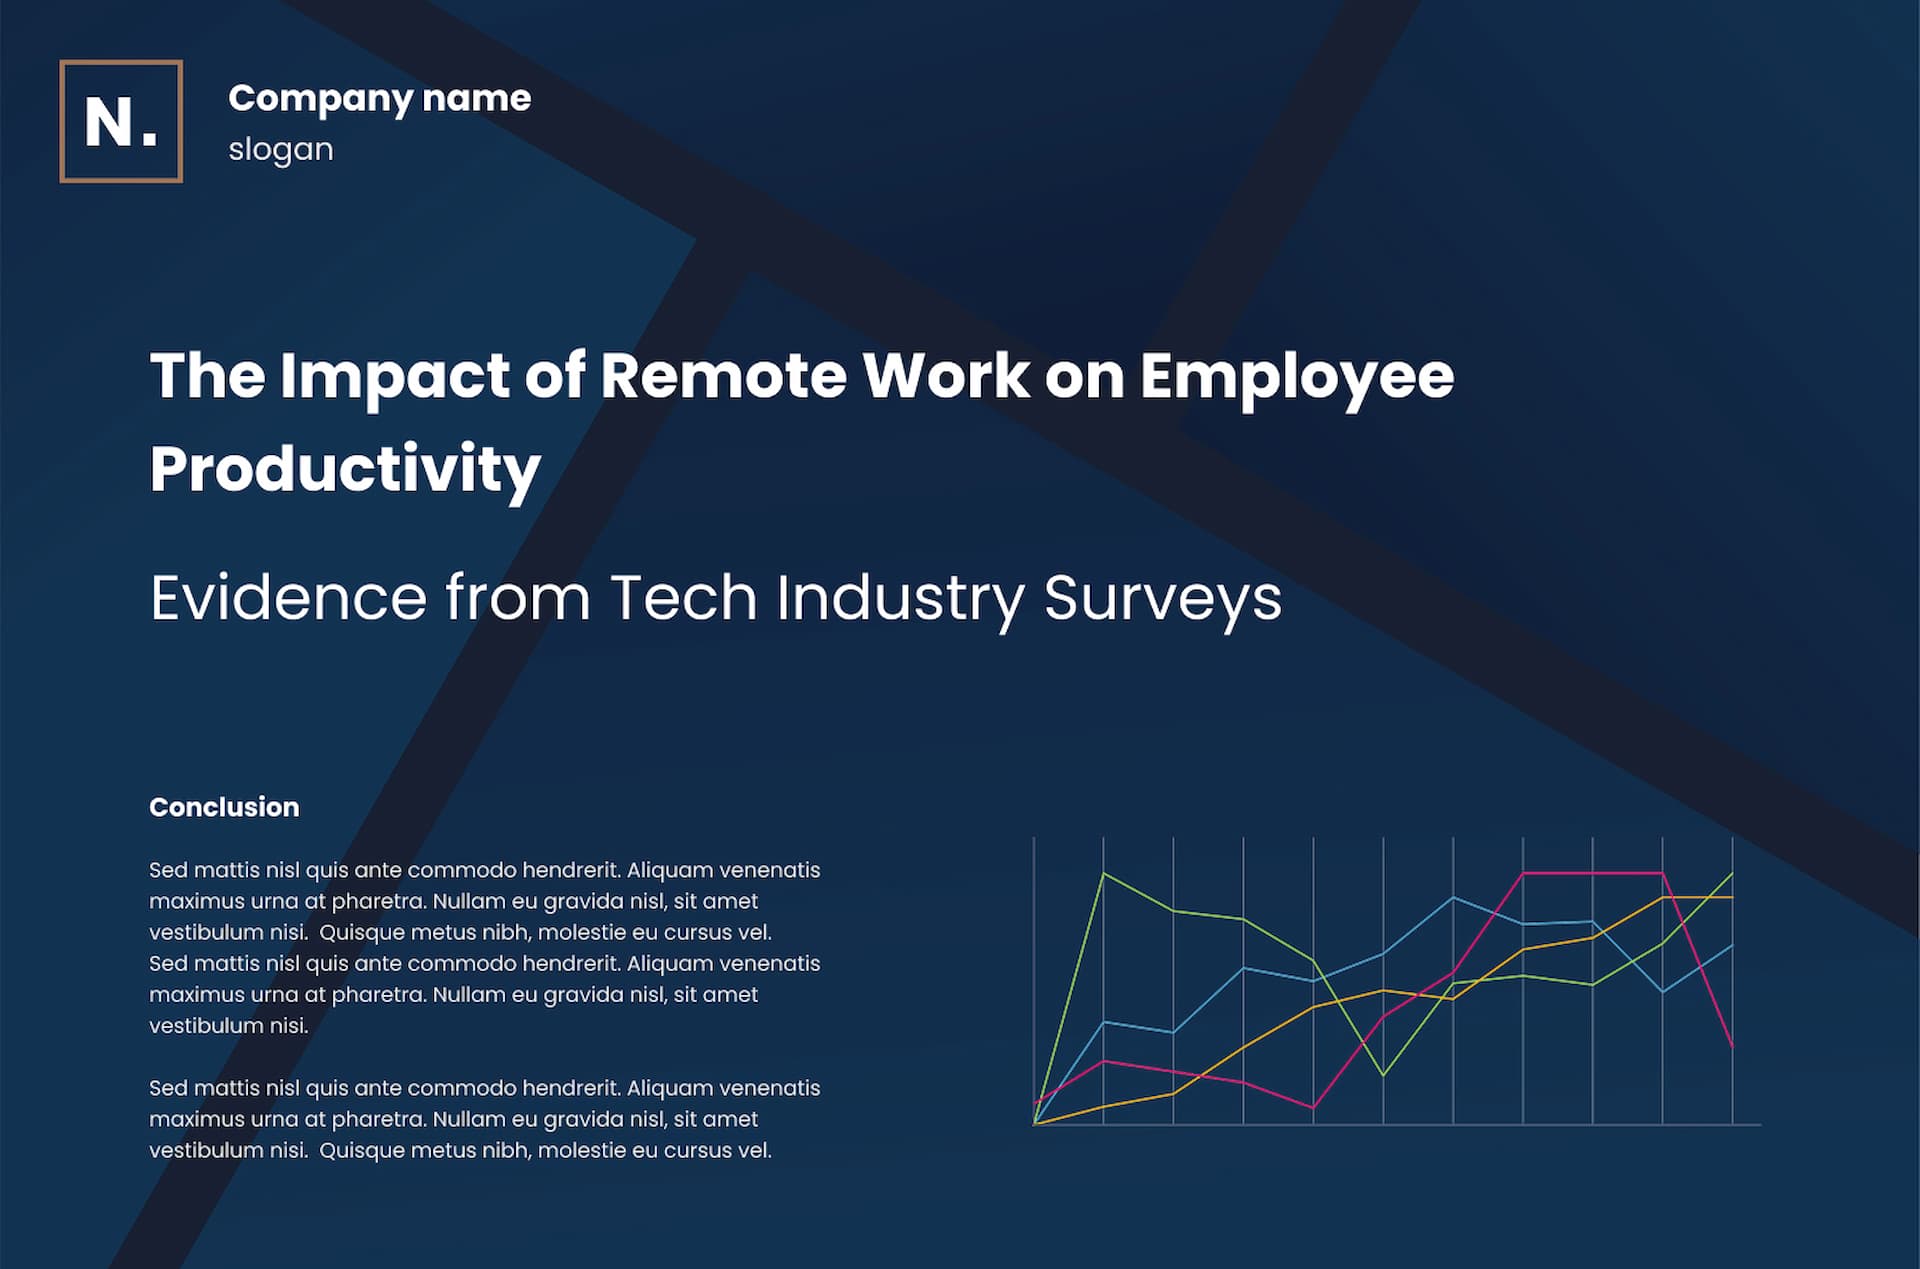
Template-Based Report Generation
Start with pre-designed templates in the AI Report Infographic Generator, ensuring your reports are visually compelling while maintaining structure and clarity.
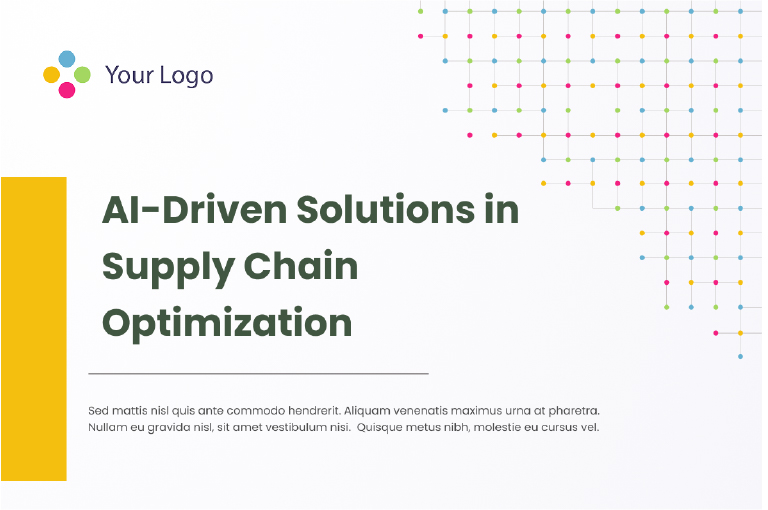
Business Reports
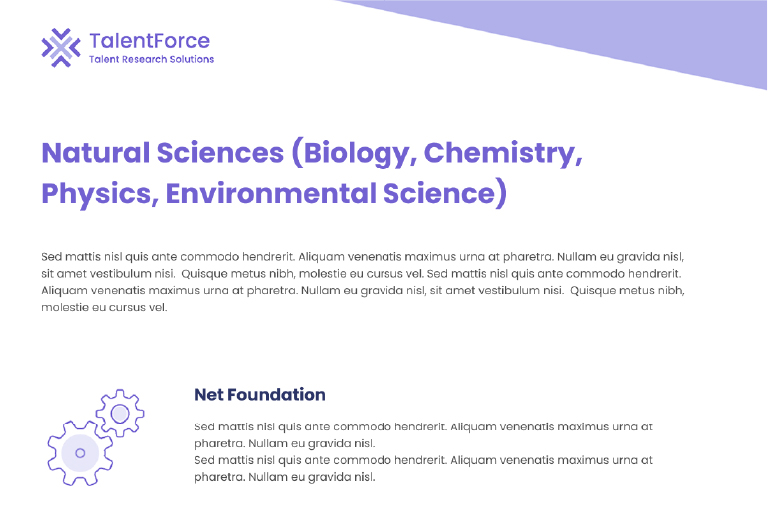
Academic Research Reports
Marketing Performance Dashboards
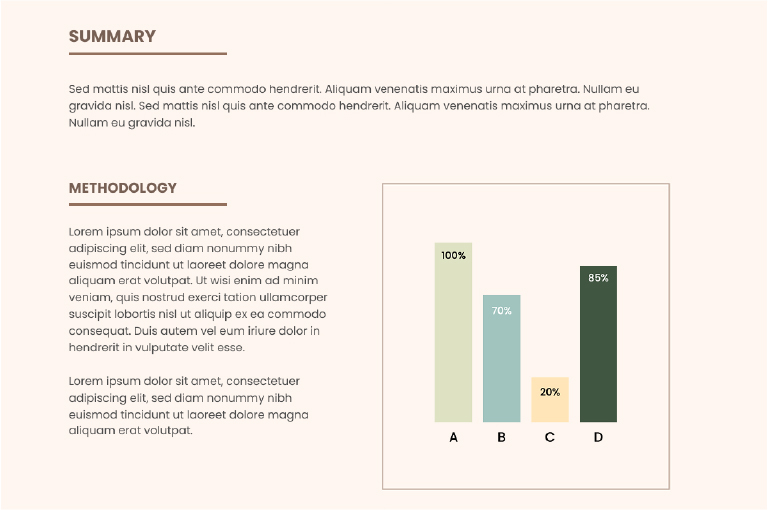
Customizable Visuals
Every infographic generated with the AI Report Infographic Generator can be edited - adjust titles, layouts, chart styles, and text to match your project goals.
Edit Titles and Summaries
Adjust Chart Styles
Rearrange Layouts
Flexible Data Input
Users can directly input datasets, upload files, or paste external links, allowing the AI Report Infographic Generator to generate precise and visually rich reports
Manual Data Entry
File Uploads
External Link Import
Export and Presentation Ready
The AI Report Infographic Generator supports exporting in widely used formats, so your reports are always ready for printing, presentations, or digital sharing when needed
Export to PDF
Export to PNG
Easy File Download
Inspiring Use Cases and Stories

Product Manager - Monthly Roadmap
Policy Analyst - Evidence Brief

Marketing Lead — Campaign Snapshot
User Stories
Simplified Quarterly Reporting

A Researcher’s Best Tool
Client-Ready Business Reports
How to Use the AI Report Infographic Generator
Select a Template
Choose from ready-made templates for your report type
Provide Your Data
Upload CSV/Excel files, paste external data links, or manually input your data directly
Generate the Report
The AI Report Infographic Generator processes your data and creates a structured, ready-to-edit report
Customize Your Report
Edit chart styles, text summaries, and layouts to perfectly fit your audience
Export and Share
Download your final report in PDF or PNG, or present it directly
FAQ for AI Report Infographic Generator
01
What is the AI Report Infographic Generator?
The AI Report Infographic Generator is a tool that allows users to select templates and create fully editable report infographics. It generates charts and summaries from your data, enabling professional reports in minutes.
02
How does the AI Report Infographic Generator work?
The AI Report Infographic Generator works by guiding you through template selection, data input, and instant infographic generation. You can manually enter data, upload files, or paste external links. Once generated, you can customize layouts, charts, and text for professional-quality reports.
03
Can I edit reports after generation?
Yes. The AI Report Infographic Generator is fully editable. You can change chart types, adjust styles, edit summaries, rearrange layouts, and refine the text. This flexibility ensures every report meets your unique requirements for business, education, or research purposes.
04
What types of templates are available?
The AI Report Infographic Generator offers templates for business reports, academic research, and marketing performance dashboards. Each template provides a professional structure, helping you focus on insights instead of formatting. Templates are also customizable for different industries.
05
What data input methods are supported?
The AI Report Infographic Generator supports multiple input methods, including manual data entry, file uploads, and external link imports. This flexibility allows you to work with data in different formats and ensures accurate visualization no matter your source.
06
What export formats are available?
You can export your reports as PDF or PNG files. The AI Report Infographic Generator ensures print-ready PDF outputs for formal reporting and high-quality PNG files for digital presentations or sharing. Exporting is simple, fast, and reliable.
07
Who can benefit from the AI Report Infographic Generator?
The AI Report Infographic Generator is designed for business professionals, educators, researchers, analysts, and marketers. Anyone who needs to transform complex data into clear and impactful reports can benefit from this tool.
08
Is the AI Report Infographic Generator suitable for academic use?
Yes. The AI Report Infographic Generator is widely used by students and researchers to present complex datasets in academic reports. It allows quick data-to-visual conversion while maintaining professional standards required for research documentation.
09
Do I need design skills to use the tool?
No design experience is needed. The AI Report Infographic Generator provides pre-built templates and AI-assisted visualization. You simply input your data, and the system generates a structured report that you can edit and customize without advanced design knowledge.
10
How long does it take to create a report?
Most users create a report in just minutes. With the AI Report Infographic Generator, selecting a template, uploading data, and generating visuals is nearly instant. Editing and finalizing a report typically takes less than 1 minutes.
11
Can I create multiple reports?
Yes. The AI Report Infographic Generator allows you to create unlimited reports. Each project can be tailored with different templates, datasets, and visual styles, ensuring that every report meets specific goals or audiences.
12
How customizable are the charts?
Charts generated with the AI Report Infographic Generator are fully customizable. You can edit chart titles, colors, data points, and layouts. This ensures that your reports not only look professional but also reflect your data story accurately.
13
Is the AI Report Infographic Generator secure?
Yes. Data security is a priority. The AI Report Infographic Generator processes your information securely and allows you to download reports directly, without unnecessary exposure to third-party risks.