Description
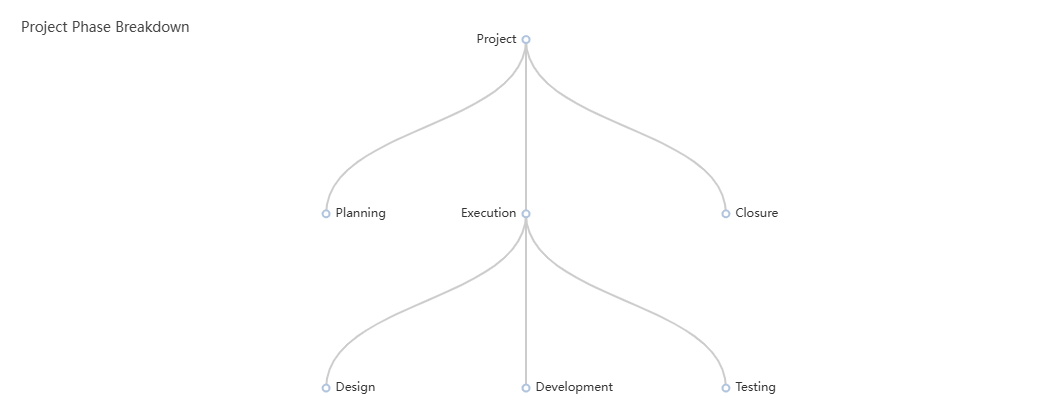
The organization chart for software system component interaction is a critical visual representation that maps out how different components within a software system work together.
At the highest level, the chart depicts the entire software system. Below this, the system is divided into major subsystems or modules. Common examples include the user interface layer, business logic layer, data access layer, and external services integration layer. Each of these subsystems is further broken down into individual components. For instance, the user interface layer may consist of components like authentication module, dashboard module, and reporting module. Lines or arrows connect these components, indicating the flow of data and control between them. These connections show which components interact directly and the sequence of these interactions.
Interpretation and Applications
This chart serves as a blueprint for understanding the software system's architecture. Developers can use it to grasp the system's structure and the roles of various components. It helps in identifying potential bottlenecks or areas where changes might have widespread impacts. For example, if a component in the business logic layer is connected to multiple other components, modifying it could require careful consideration of how it affects the entire system.
For system architects, the chart is a valuable tool for designing and refining the system's architecture. It allows them to ensure that components are organized logically and that interactions are efficient and secure. It also aids in planning for future expansions or integrations with other systems by showing where new components can be added and how they would interact with existing ones. In summary, the organization chart of software system component interaction is essential for the effective design, development, and maintenance of complex software systems.