Free AI Mermaid Chart Maker
Graphs Generated by AI Mermaid Chart Maker
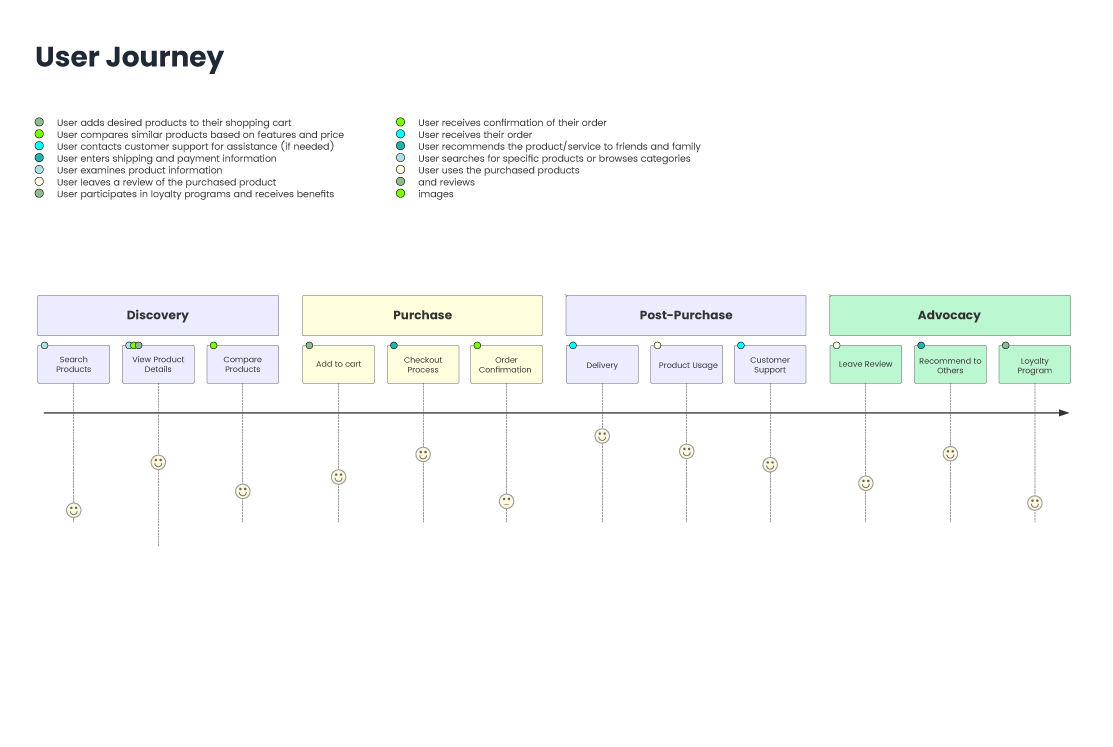
User Journey
User Journey diagram is a lightweight way to visualize user interactions with a system, step by step. It helps map the user experience across different stages, actions, and emotions. Ideal for product design, UX analysis, or onboarding flows, it's concise, text-based, and easily integrated into documentation.
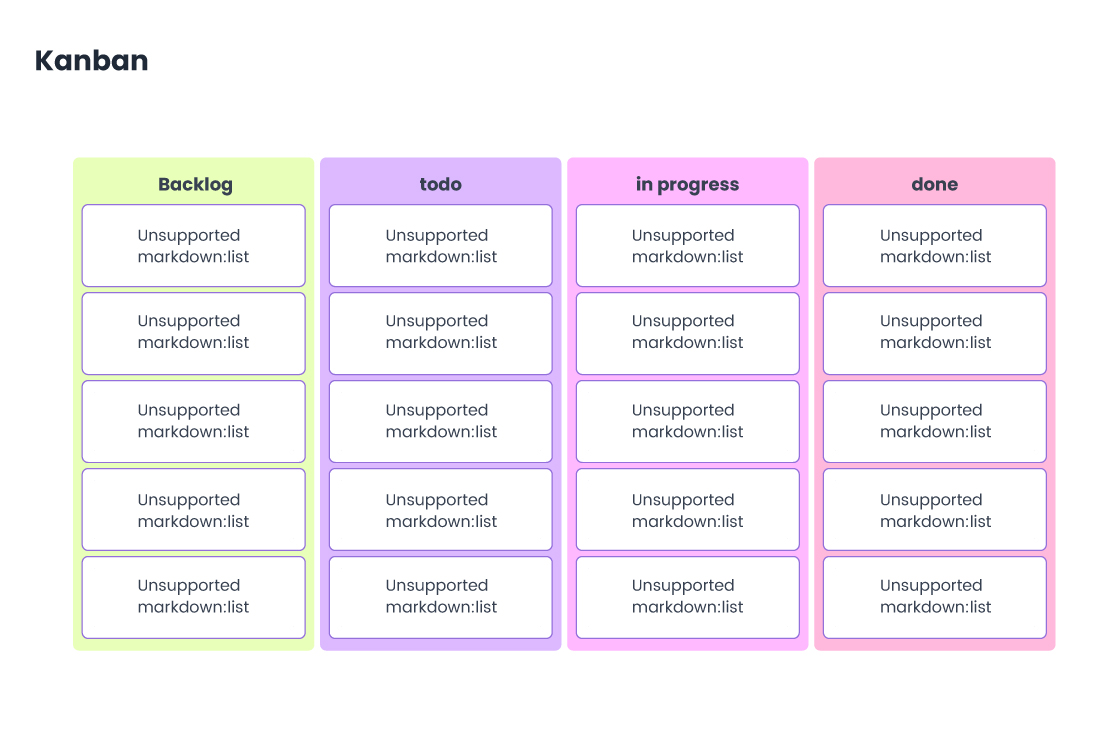
Kanban
Kanban diagram is used to visually represent workflows using cards and columns, mimicking traditional Kanban boards. It's great for tracking tasks across stages like "To Do", "In Progress", and "Done".
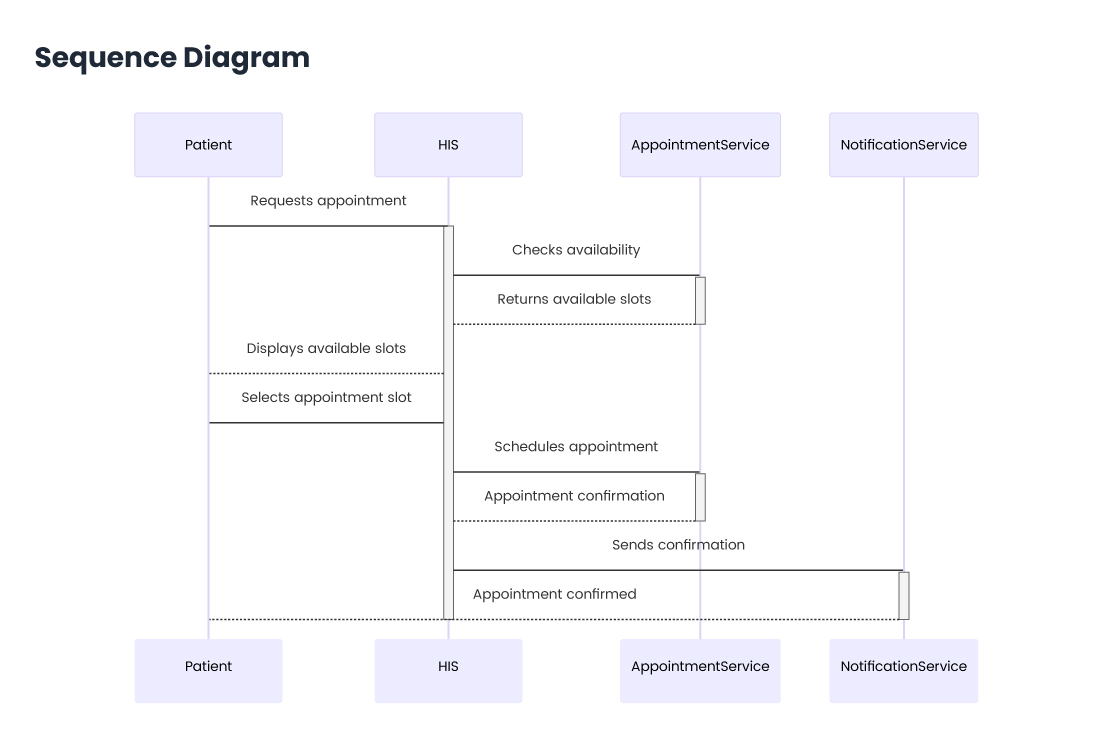
Sequence Diagram
Sequence Diagram is used to model how processes or objects interact in a specific time sequence. It's ideal for visualizing communication between components, such as API calls, user actions, or service interactions. Each participant is shown with lifelines, and arrows indicate messages exchanged, making it great for understanding system flow.
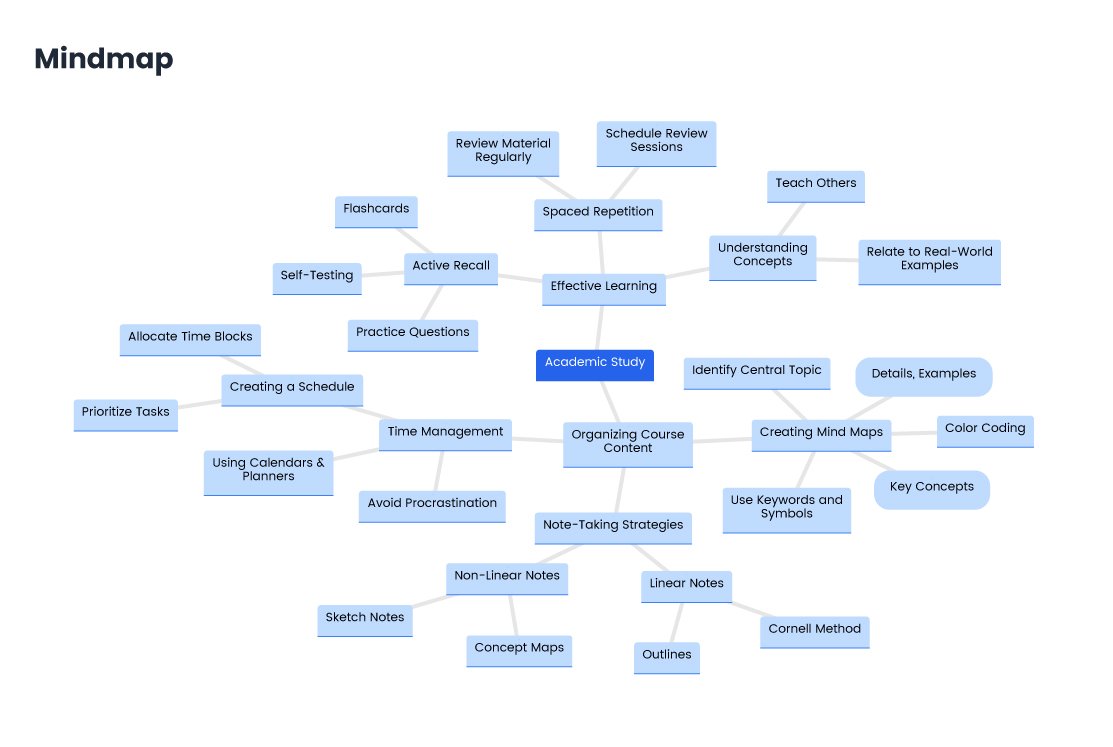
Mindmap
Mermaid's Mindmap diagram allows you to represent hierarchical ideas visually, starting from a central concept and branching into related topics. It's ideal for brainstorming, outlining, and structuring knowledge.
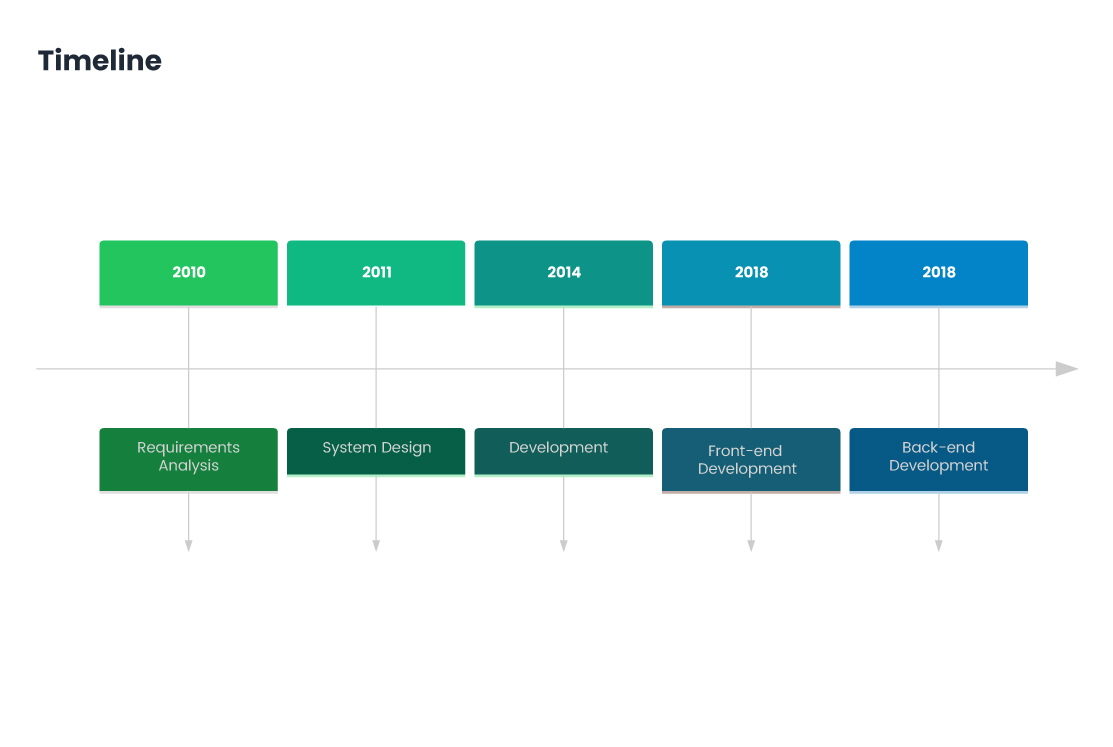
Timeline
Mermaid's Timeline diagram is used to visualize events or milestones in chronological order. It's ideal for showcasing project schedules, historical events, product roadmaps, or personal achievements.
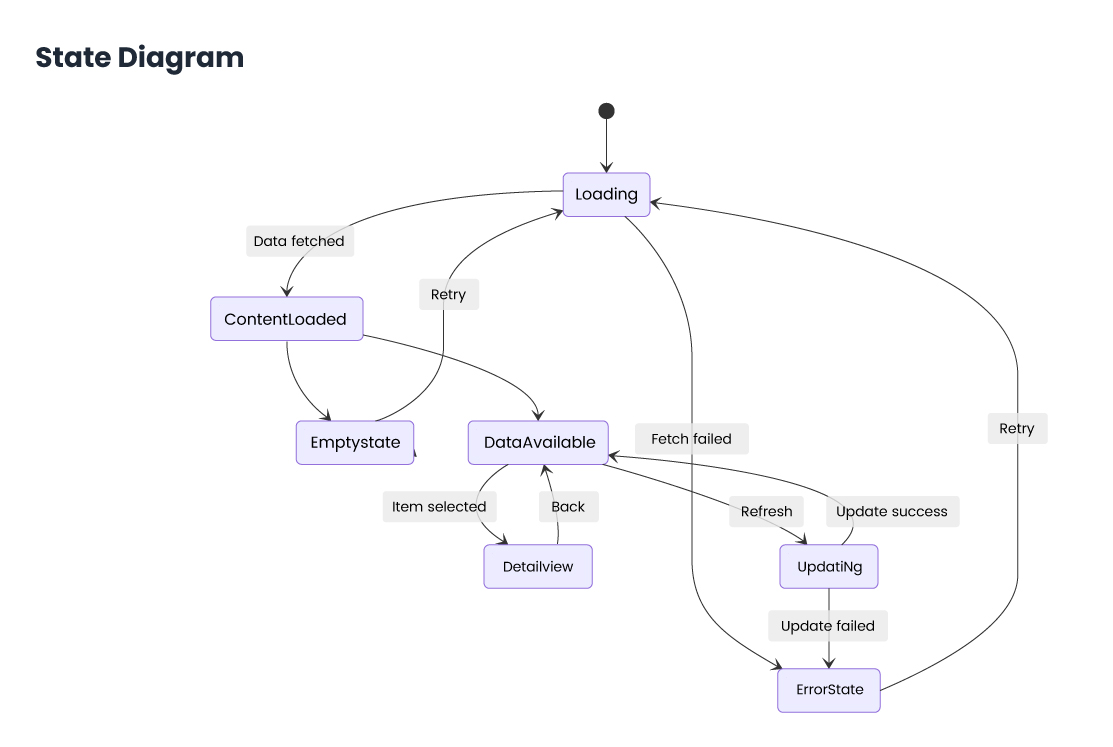
State Diagram
Mermaid's State Diagram is used to represent the different states an object or system can be in, and the transitions between those states based on events or conditions.
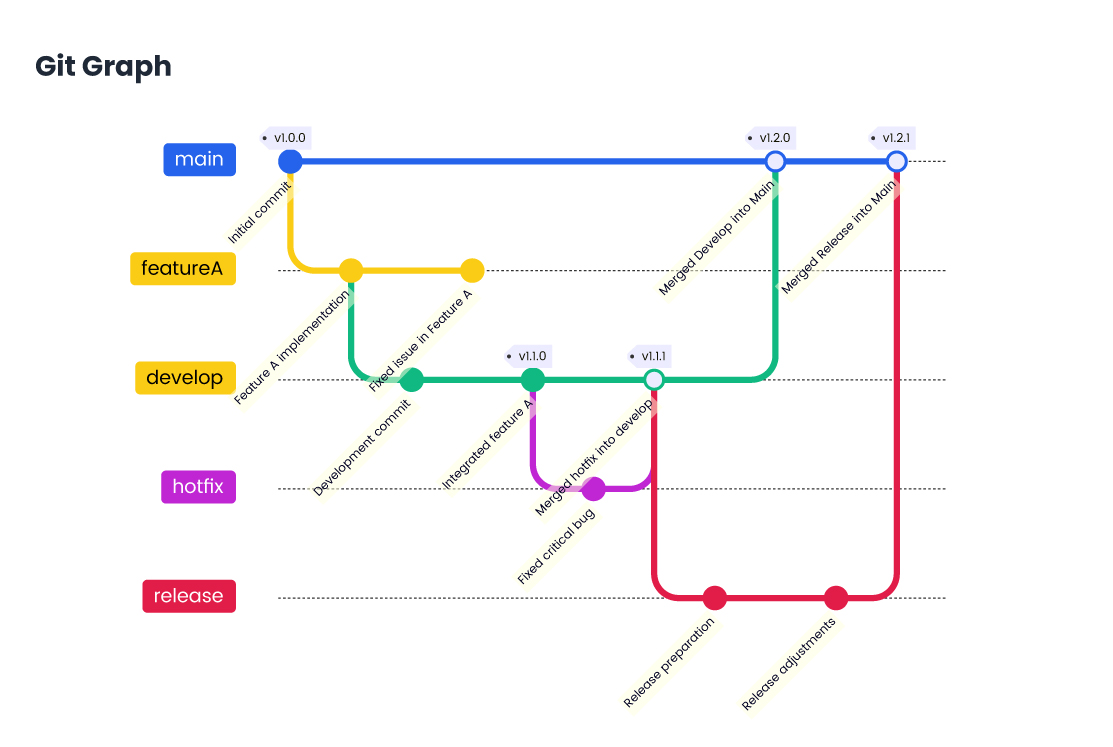
Git Graph
Mermaid's Git Graph diagram is used to visualize the commit history and branching structure of a Git repository. It shows commits, branches, merges, and the relationship between them in a clear, visual format. This is helpful for understanding the development workflow, tracking feature branches, and viewing the overall Git history in a simple, easy-to-read chart.
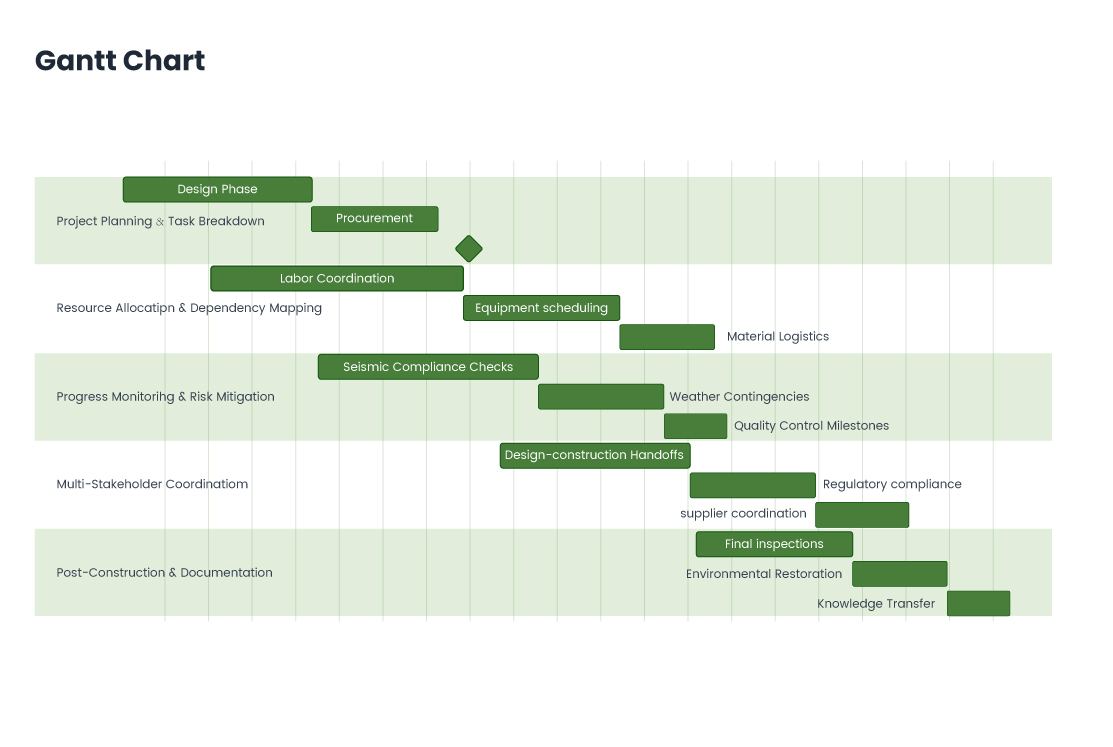
Gantt Chart
Mermaid's Gantt Chart is used to represent project timelines and task schedules. It visually displays tasks, their durations, dependencies, and milestones along a timeline.
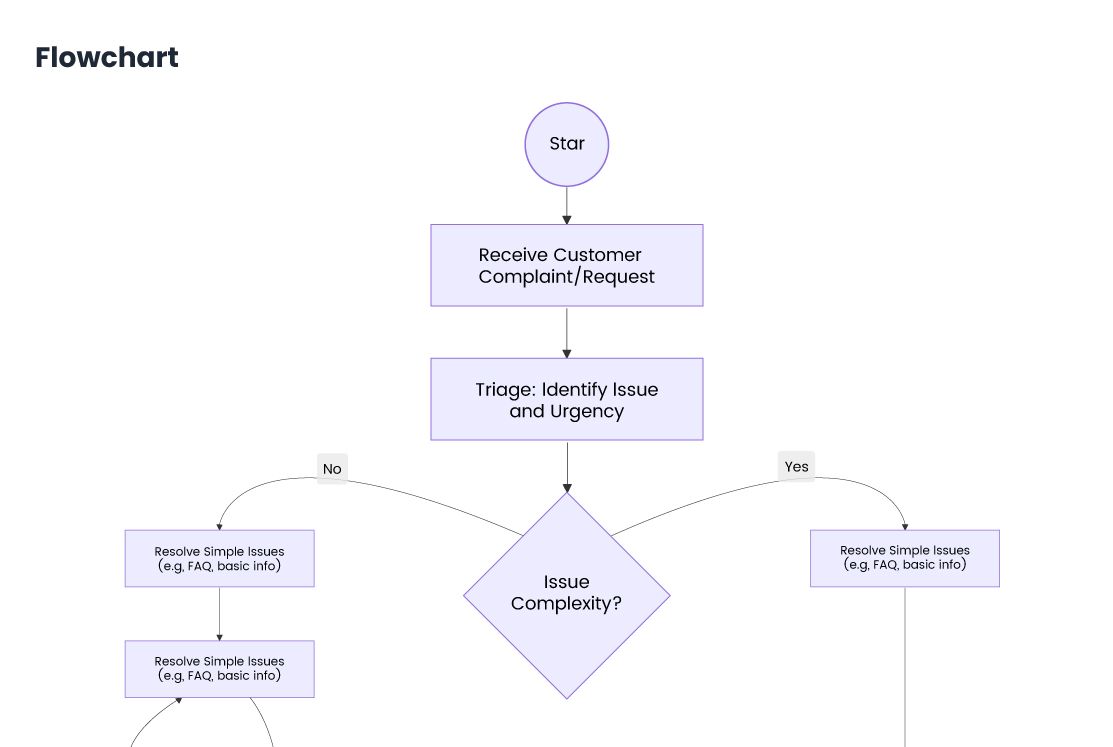
Flowchart
Mermaid's Flowchart is a diagram used to represent processes, workflows, or decision-making steps visually. It uses nodes (steps or actions) and arrows (showing flow direction) to depict the sequence of operations.
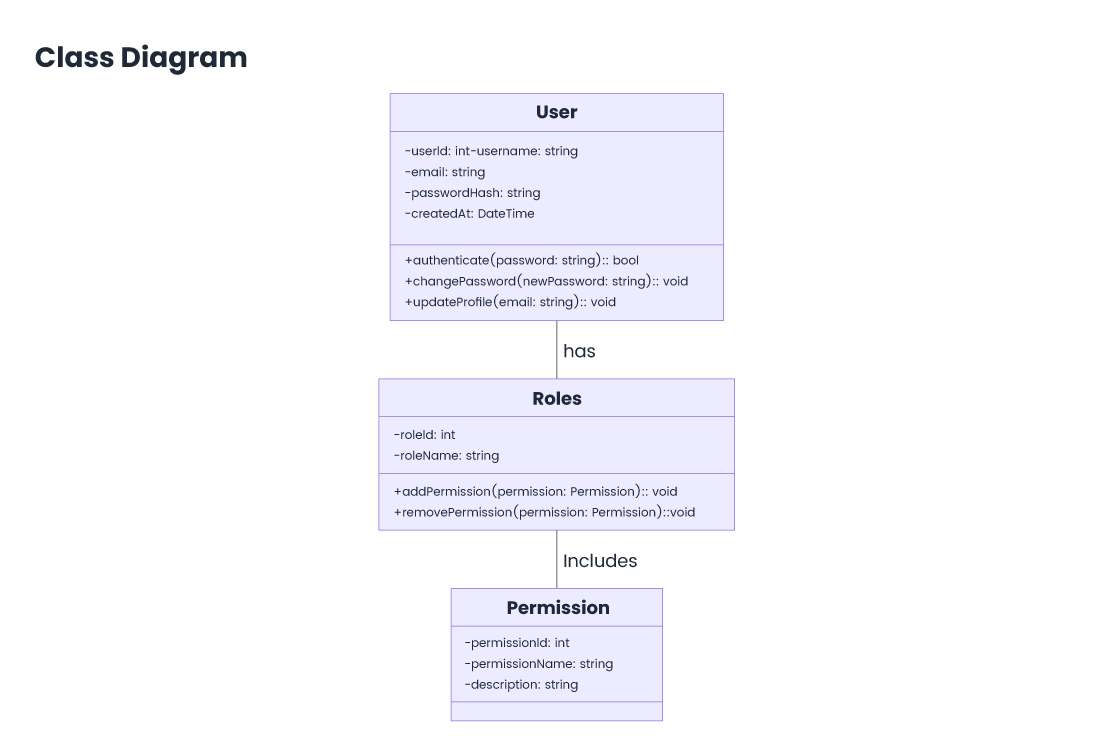
Class Diagram
Mermaid's Class Diagram is used to represent the structure of a system by showing its classes, attributes, methods, and relationships. It’s ideal for object-oriented design, helping visualize class hierarchies, inheritance, interfaces, and associations between objects.
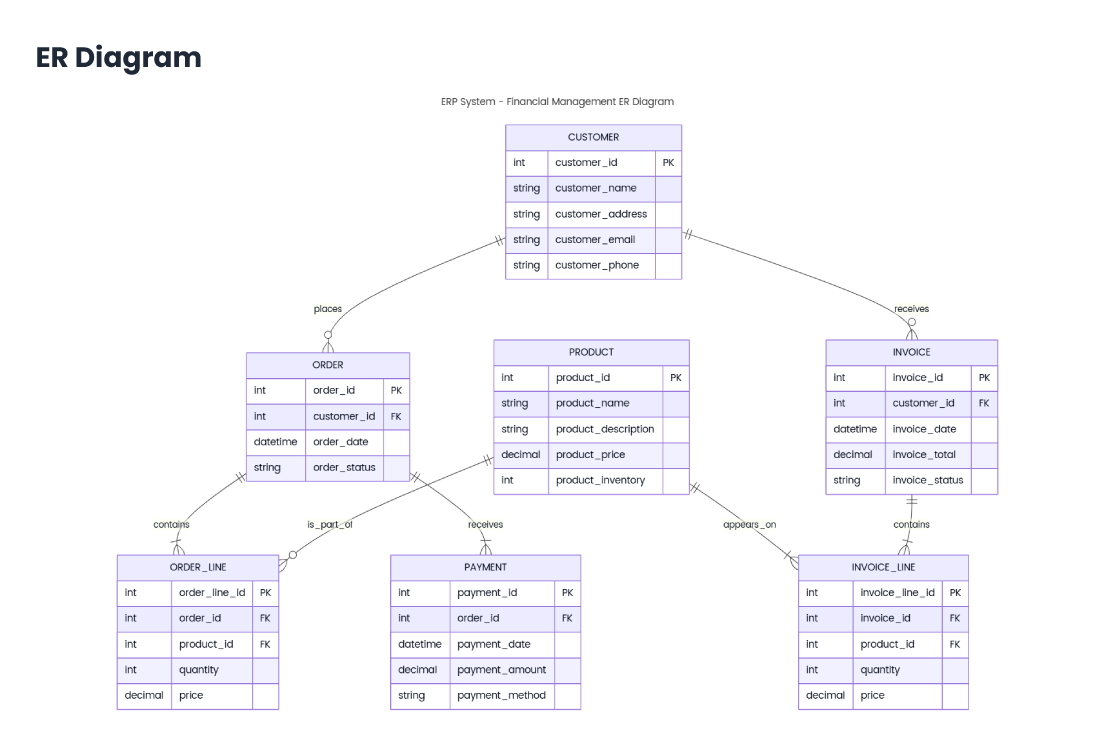
ER-Diagram
Mermaid's Entity-Relationship (ER) Diagram is used to model the relationships between entities in a database. It visually represents entities, their attributes, and the relationships between them (such as one-to-many, many-to-many).
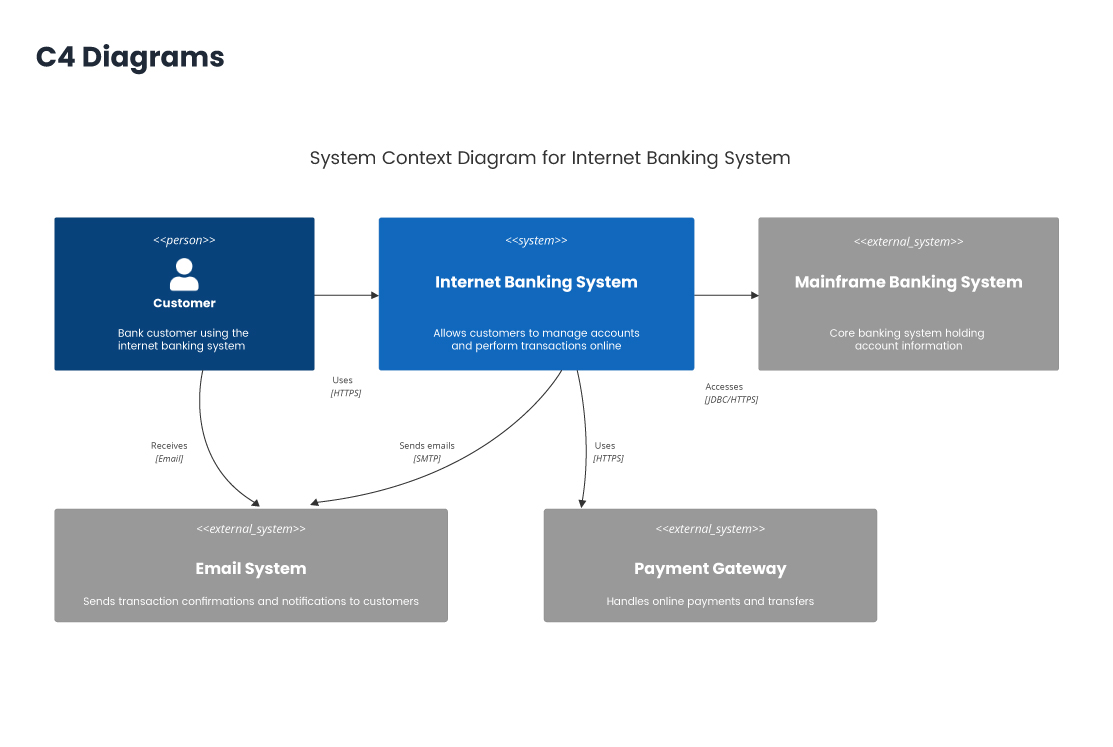
C4 Diagrams
Mermaid's C4 Diagrams are used to represent the architecture of software systems at various levels of abstraction. They consist of four main types: Context Diagram – High-level view of the system and its external interactions. Container Diagram – Shows the major containers (applications or databases) that make up the system. Component Diagram – Details the components within a container. Code Diagram – Shows the internal structure of components at the class level.
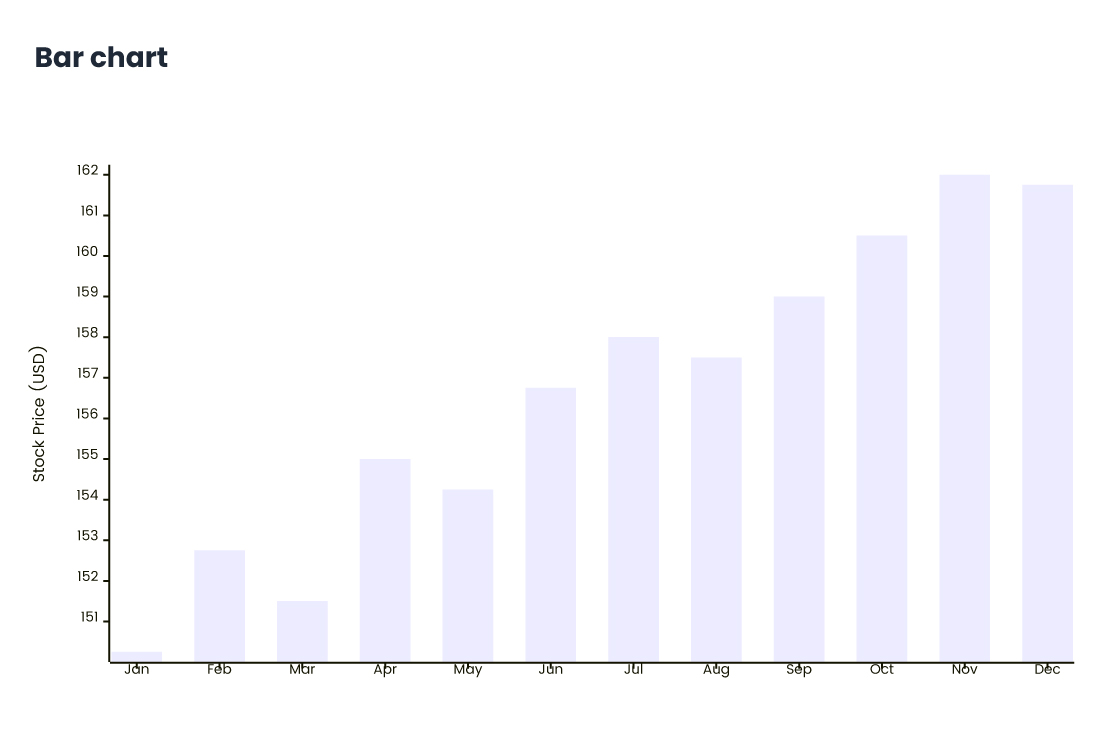
Bar Chart
Mermaid's Bar Chart is used to visualize data in the form of rectangular bars, where the length of each bar is proportional to the value it represents. It's ideal for comparing quantities across different categories or groups.
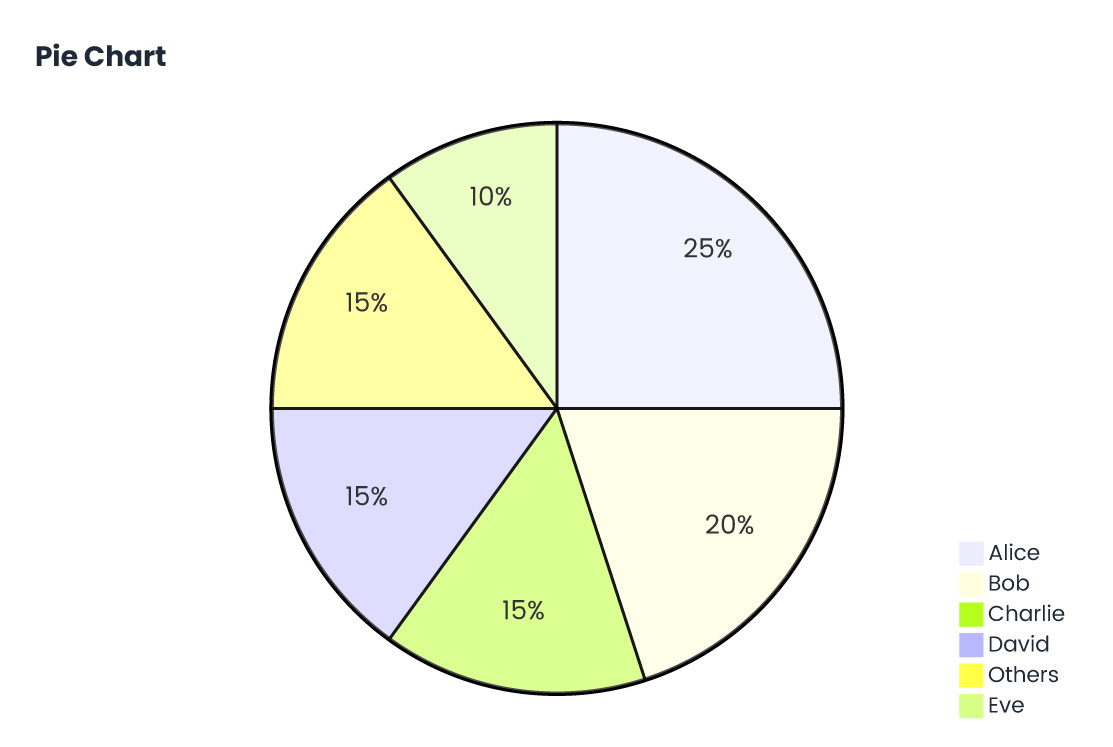
Pie Chart
Mermaid's Pie Chart is used to display data as segments of a circle, with each segment representing a proportion of the whole. It's ideal for showing relative percentages or parts of a total. While Mermaid’s pie chart functionality is simple, it can effectively communicate data distribution in a clear and visually appealing format.
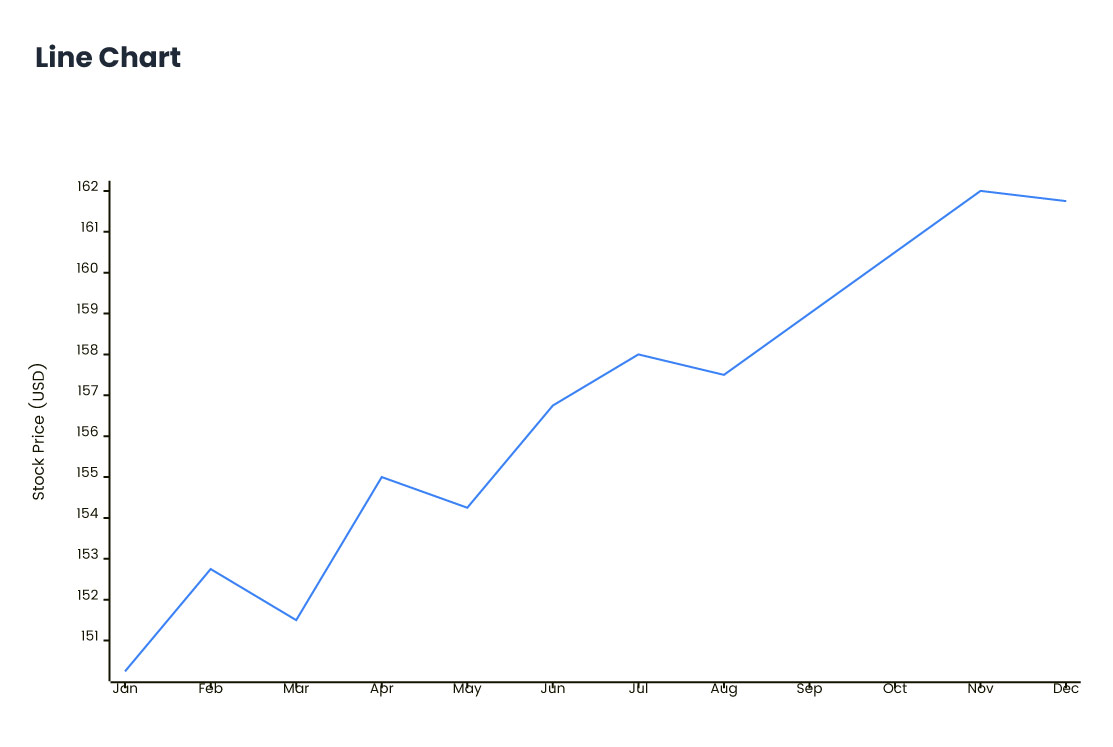
Line Chart
Mermaid's Line Chart is used to represent data points connected by straight lines, ideal for showing trends over time or continuous data. It's commonly used for visualizing changes in variables, like sales or temperature, across a time series. Mermaid's line charts are simple to create, making them great for tracking progress or comparing multiple datasets.
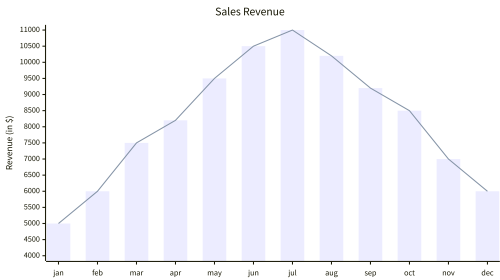
Combo
A bar with line chart, also known as a combo chart, combines bar and line graphs in one visualization. Bars typically represent discrete data categories, while the line shows trends or comparisons. This dual-axis chart is ideal for highlighting relationships between two datasets, such as volume and growth over time.
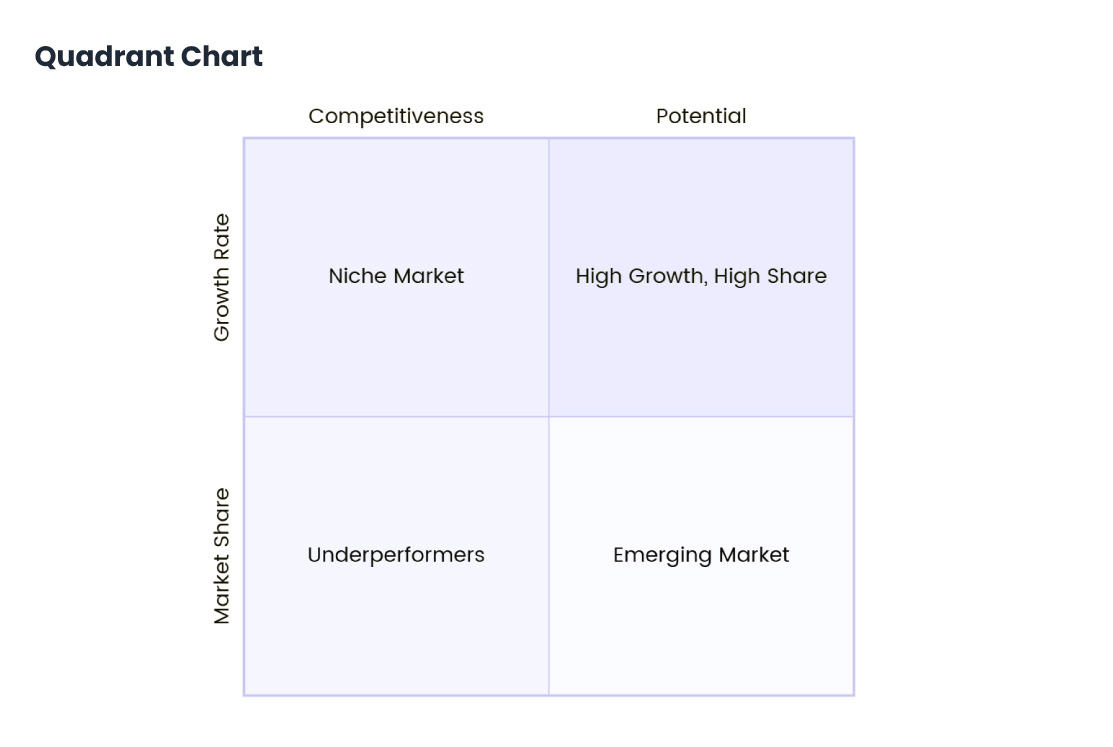
Quadrant Chart
Mermaid does not natively support Quadrant Charts, but you can visually simulate a quadrant chart by using scatter plots or custom flowcharts with custom positioning of elements. A Quadrant Chart typically divides a graph into four sections (quadrants) to represent two variables, often used for things like competitive positioning or SWOT analysis.
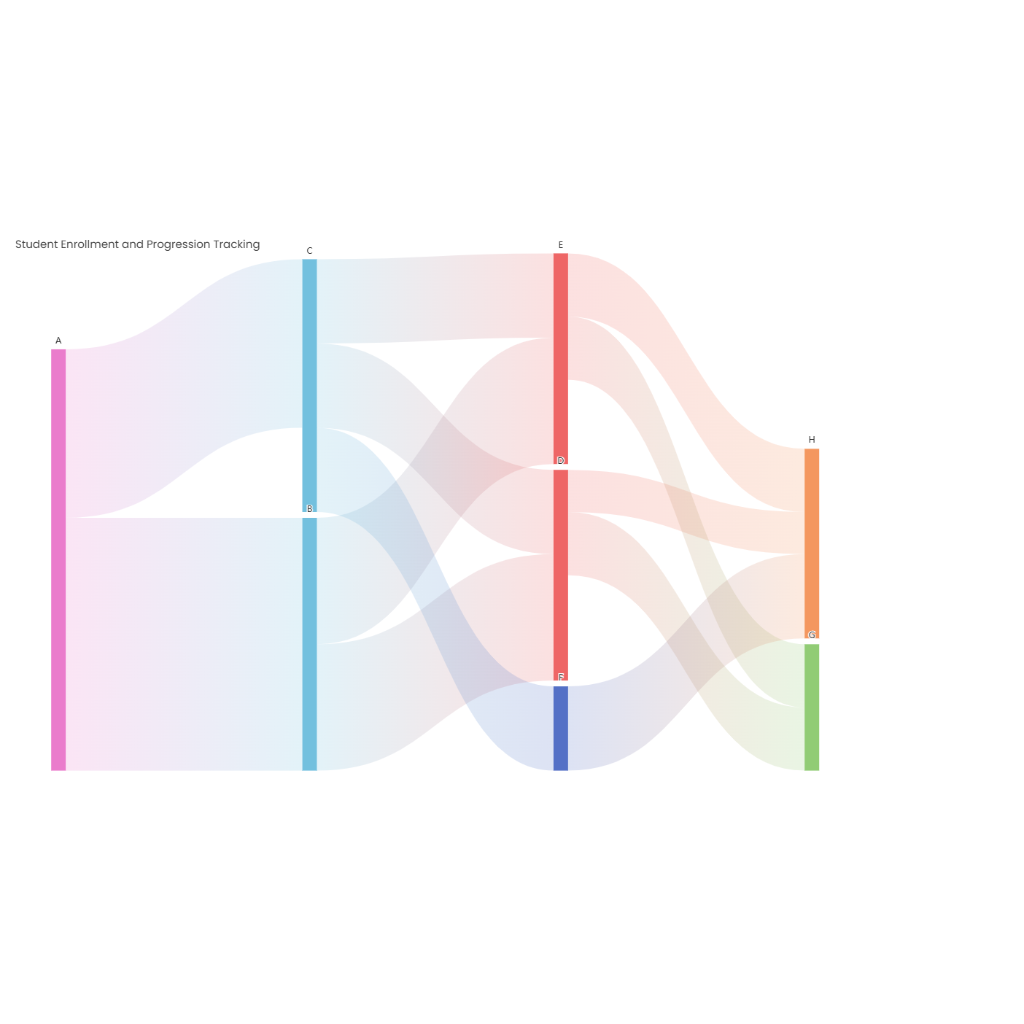
Sankey
A Sankey diagram is a flow diagram where the width of the arrows is proportional to the flow quantity. It is commonly used to visualize energy, material, or cost transfers between processes, highlighting inefficiencies or major flows in a system.
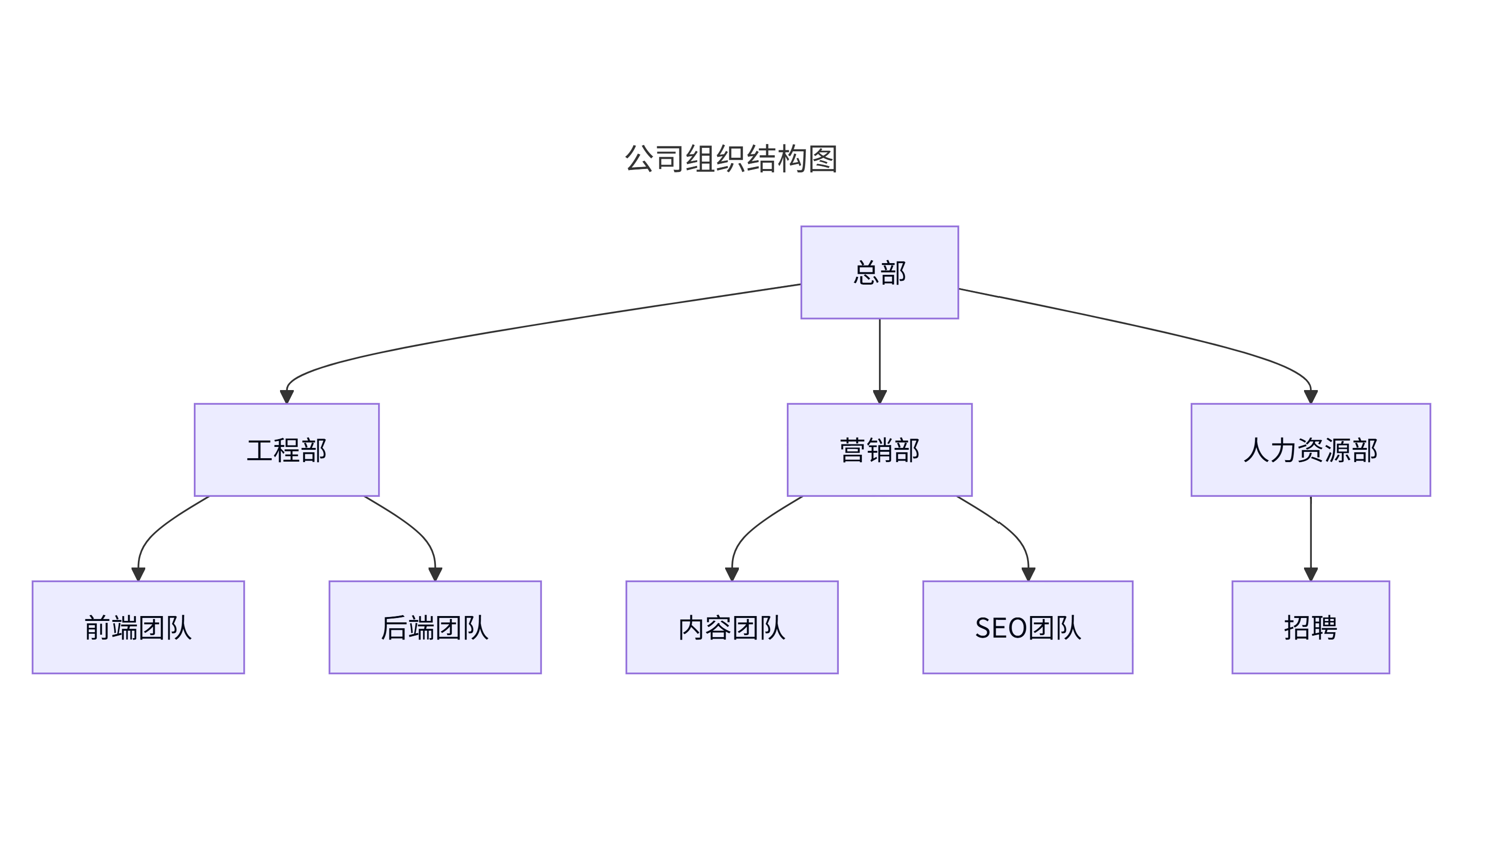
Structure Chart
A structure chart, using a top-down (TD) flowchart style, visually represents a system's hierarchical organization. It breaks down complex processes into smaller modules arranged from top (main module) to bottom (submodules). This helps clarify relationships, responsibilities, and control flow, making system design, understanding, and debugging more efficient and structured.
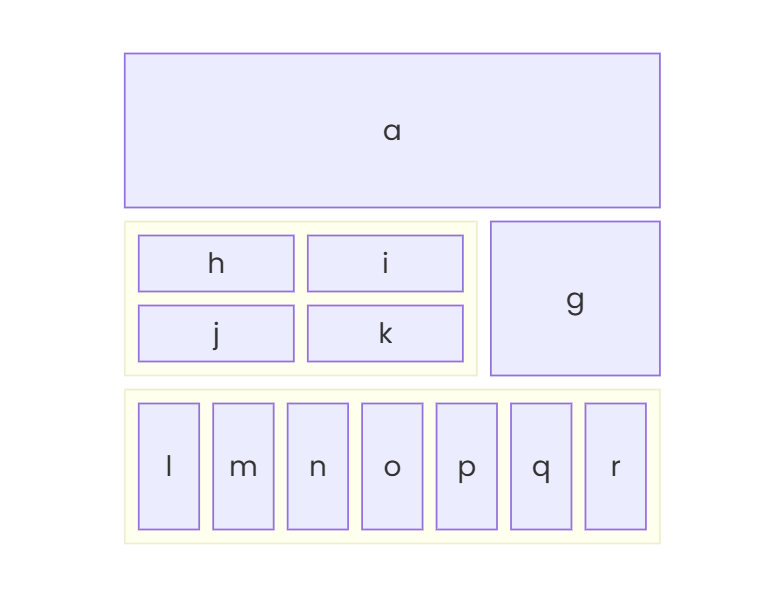
Block diagram
A block diagram is a simplified visual representation of a system, process, or concept using labeled blocks connected by lines. Each block represents a component or function, while the lines show relationships or data flow. It's commonly used in engineering, programming, and business to illustrate system structure and operation clearly.
Features of AI Mermaid Chart Maker

Automatic Chart Creation

Smart Layout Optimization

Multiple Chart Types

Real-Time Graph Updates

Seamless Tool Integration

No Setup Required
How to Use AI Mermaid Chart Maker

01
Input Your Data
Enter the data to be visualized in the Mermaid chart.
02
Select Chart Type
Choose the type of Mermaid chart (e.g., flowchart, Gantt chart).
03
Generate with AI
Click "Generate with AI" to instantly create your chart.
04
Customize the Chart
Edit colors, labels, and design elements.
05
Download and Share
Download or share your Mermaid chart easily.

Instant Chart Creation
With AI, Mermaid charts are generated instantly. Simply input your data, and within seconds, you'll have a professional chart ready for use, saving you time and effort.
Smart Adjustment
AI intelligently optimizes the structure of your Mermaid chart. It automatically adjusts the design, ensuring your graph is clear, visually appealing, and easy to understand.

Multiple Chart Types
Whether you need a flowchart, Gantt chart, or sequence diagram, our AI tool supports various Mermaid chart types, giving you the flexibility to choose the best visualization for your data.

Easy Customization
Customize your Mermaid charts with ease. Modify colors, labels, and styles to suit your needs, allowing you to personalize the chart without any technical skills.

Seamless Integration
The AI-generated Mermaid charts can be easily embedded into platforms like GitHub, Markdown, and more. This seamless integration makes it easy to share your charts for collaboration.

No Setup Required
You don’t need any extra setup. Mermaid charts are generated directly in your browser, eliminating the need for external servers or software installation.
FAQs for AI Mermaid Chart Maker
01
How do I generate a Mermaid chart with AI?
Simply input concise text commands, and the AI tool will automatically generate Mermaid charts, effortlessly visualizing processes, tasks, or system architectures, enabling you to quickly create efficient charts.
02
How do I generate a Mermaid chart with AI?
Simply input concise text commands, and the AI tool will automatically generate Mermaid charts, effortlessly visualizing processes, tasks, or system architectures, enabling you to quickly create efficient charts.
03
What types of Mermaid charts does the tool support?
Our tool supports generating various types of Mermaid charts, including flowcharts, Gantt charts, sequence diagrams, class diagrams, state diagrams, and more, catering to different needs and providing comprehensive visualization support.
04
Can I edit the AI-generated Mermaid chart?
Yes, AI-generated Mermaid charts are fully editable, allowing you to customize colors, labels, layouts, and more to suit your needs, ensuring the chart fits your project or personal preferences.
05
How to Export AI-Generated Mermaid Charts?
AI-generated Mermaid charts can be easily exported in PNG, SVG, or Mermaid format, making it simple to reuse in other documents or platforms. Whether for project sharing, embedding on websites, or integrating into reports, Mermaid charts efficiently support your data visualization needs.
06
How does the AI-generated Mermaid chart assist in project management?
AI-generated Mermaid charts, such as Gantt charts and flowcharts, help teams clearly define tasks, track progress in real-time, and streamline project management processes. With Mermaid charts, teams can boost collaboration, ensure timely project completion, and optimize decision-making, ultimately improving productivity and project success rates.
07
How do I use Mermaid charts on GitHub?
You can embed AI-generated Mermaid charts into your GitHub README files to enhance the visualization of your project documentation. With Mermaid charts, project workflows, structures, and data become more intuitive, helping teams and developers better understand and communicate project details.
08
What industries can benefit from AI-generated Mermaid charts?
AI-generated Mermaid charts are applicable across various industries, including software development, project management, marketing, product design, and education. They provide efficient data visualization support, enhancing workflow management, project tracking, data analysis, and decision-making. Mermaid charts significantly improve productivity and decision quality in any industry.
09
Can I integrate Mermaid charts into other tools?
Yes, AI-generated Mermaid charts can be seamlessly integrated into tools like Markdown, Jira, and Notion, making collaboration and sharing easier. By embedding Mermaid charts into documents or platforms, you can effortlessly present complex data and workflows, improving efficiency, communication, and decision-making.
10
How does AI ensure the accuracy of the Mermaid chart?
Our AI tool intelligently analyzes user input and automatically optimizes the layout and structure, ensuring the accuracy of the generated Mermaid charts. Powered by advanced algorithms, the AI chart generator automatically adjusts the chart based on data and workflows, ensuring efficient and precise visual representation.
11
Can I use custom styles in my Mermaid chart?
Yes, you can use custom styles in Mermaid charts to adjust the appearance, including colors, fonts, node sizes, and more, fully customized to your needs. With the AI chart generator, you can easily create personalized designs that align with your project style and branding requirements.
12
Do I need programming knowledge to use AI-generated Mermaid charts?
No programming knowledge is required to use AI-generated Mermaid charts. Simply input concise text commands, and the AI will automatically generate beautiful Mermaid charts, making it easy to use for users of all skill levels.
13
Are Mermaid charts updated in real time?
Yes, you can update the input data, and the AI will instantly refresh the generated Mermaid charts, ensuring they are always synchronized with the latest data for accurate visual representation.