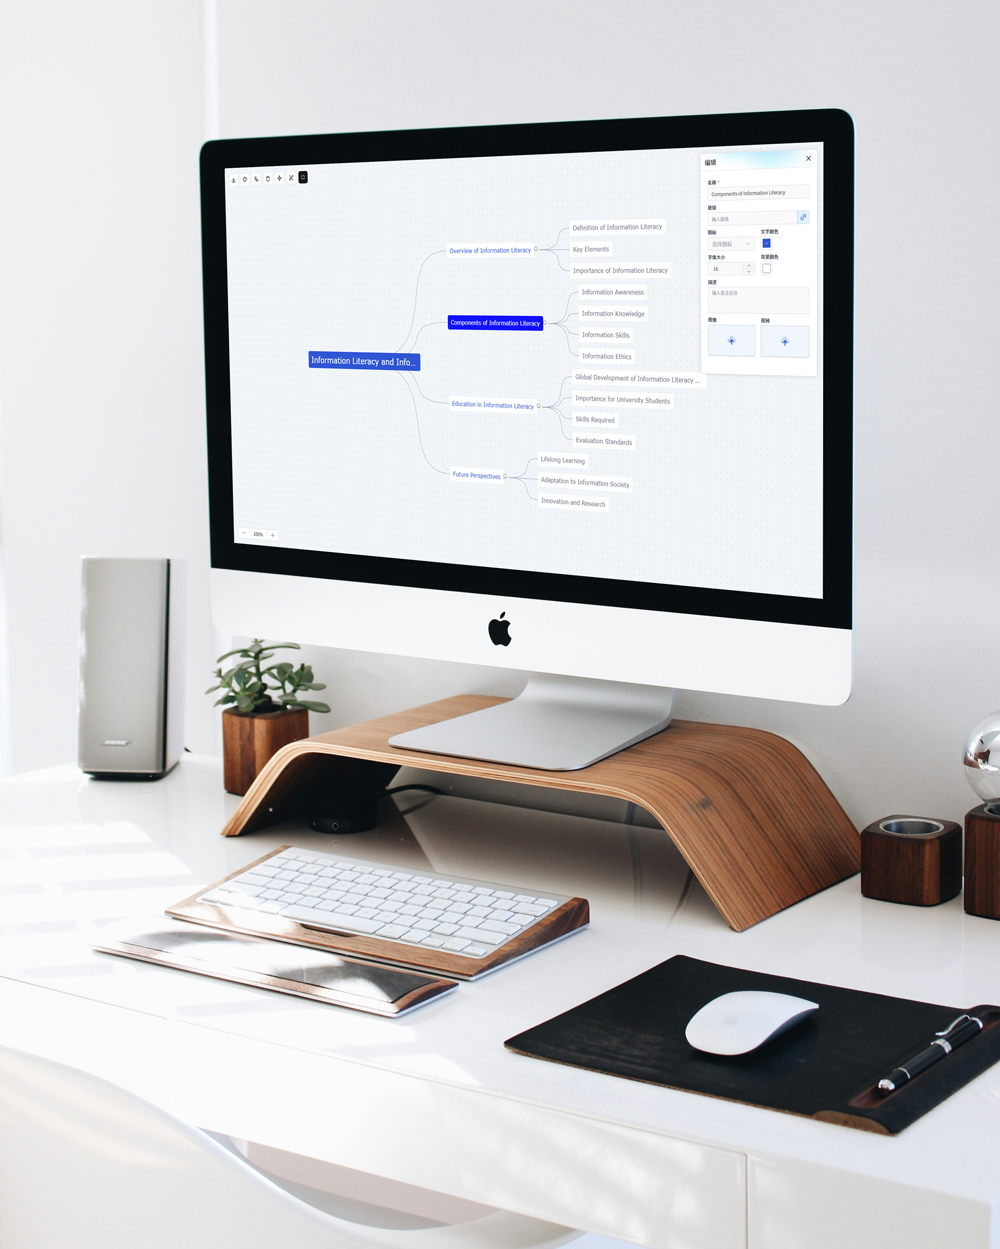
Gratis AI Mermaid Chart Maker
Grafieken gegenereerd door AI Mermaid Chart Maker
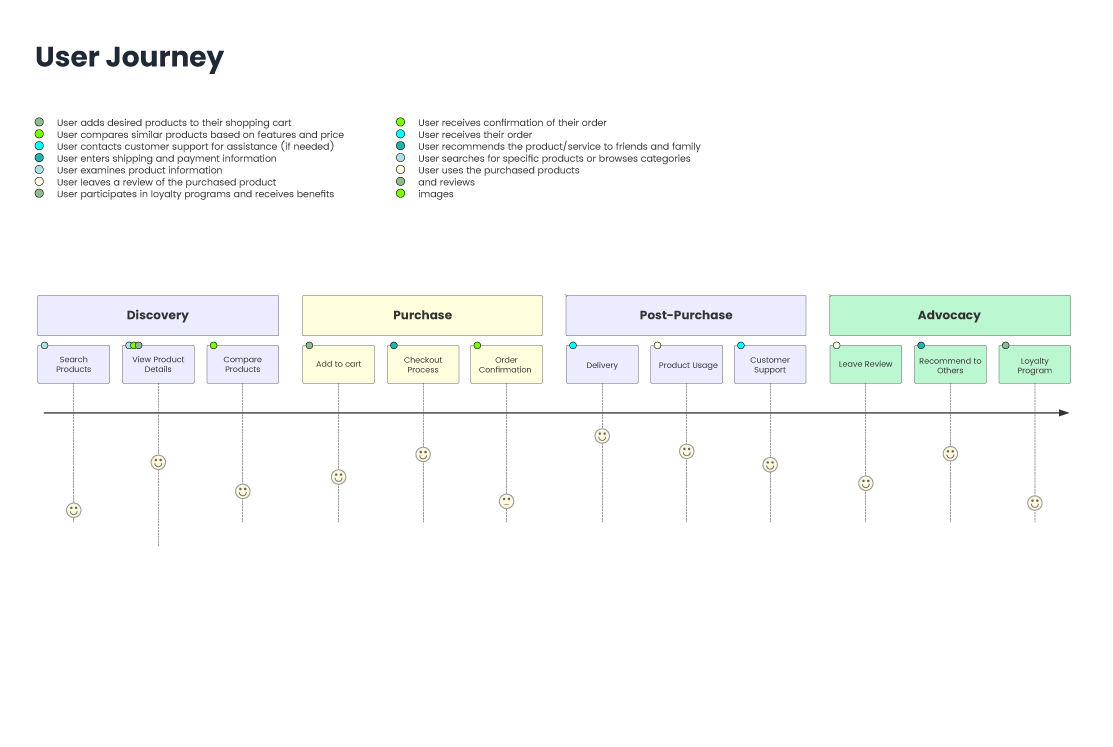
Gebruikersreis
Het gebruikersreisdiagram is een eenvoudige manier om gebruikersinteracties met een systeem stap voor stap te visualiseren. Het helpt de gebruikerservaring in kaart te brengen over verschillende fasen, acties en emoties. Ideaal voor productontwerp, UX-analyse of onboarding-flows, het is beknopt, tekstueel en gemakkelijk te integreren in documentatie.
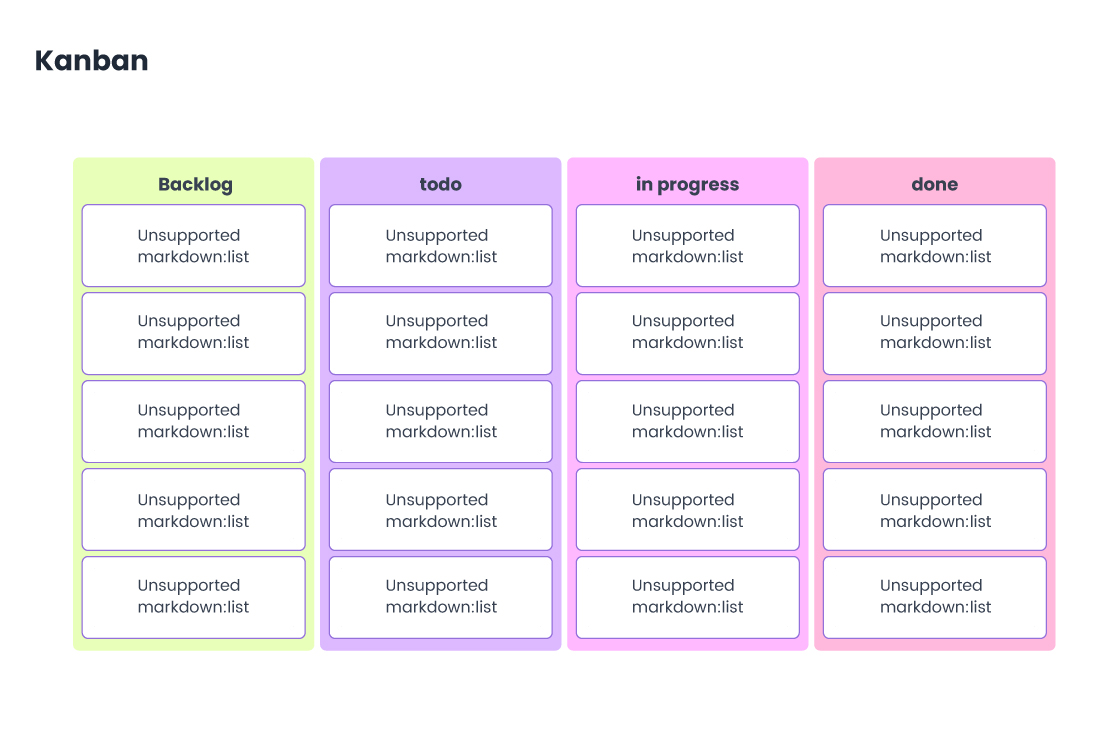
Kanban
Het Kanban-diagram wordt gebruikt om workflows visueel weer te geven met behulp van kaarten en kolommen, een nabootsing van traditionele Kanban-borden. Het is perfect voor het volgen van taken in verschillende fasen, zoals 'Te doen', 'In uitvoering' en 'Klaar'.
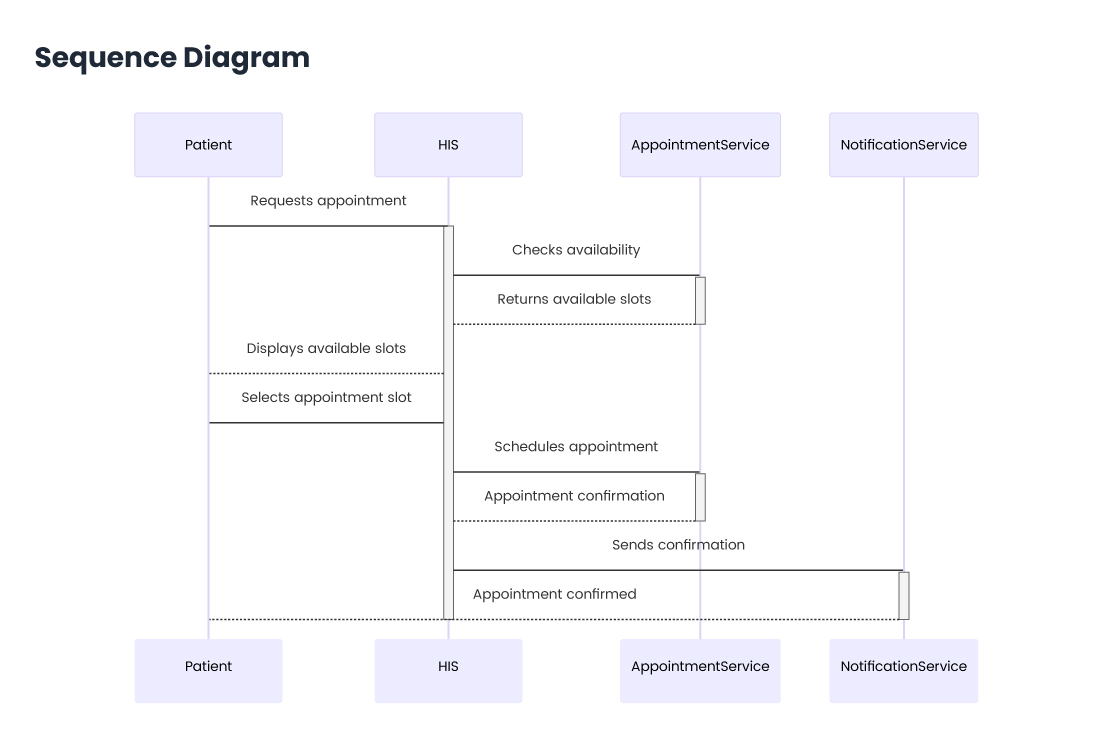
Sequentiediagram
Het sequentiediagram wordt gebruikt om te modelleren hoe processen of objecten in een specifieke tijdsvolgorde met elkaar interageren. Het is ideaal voor het visualiseren van communicatie tussen componenten, zoals API-aanroepen, gebruikersacties of service-interacties. Elke deelnemer wordt weergegeven met levenslijnen en pijlen geven uitgewisselde berichten aan, waardoor het perfect is om de systeemstroom te begrijpen.
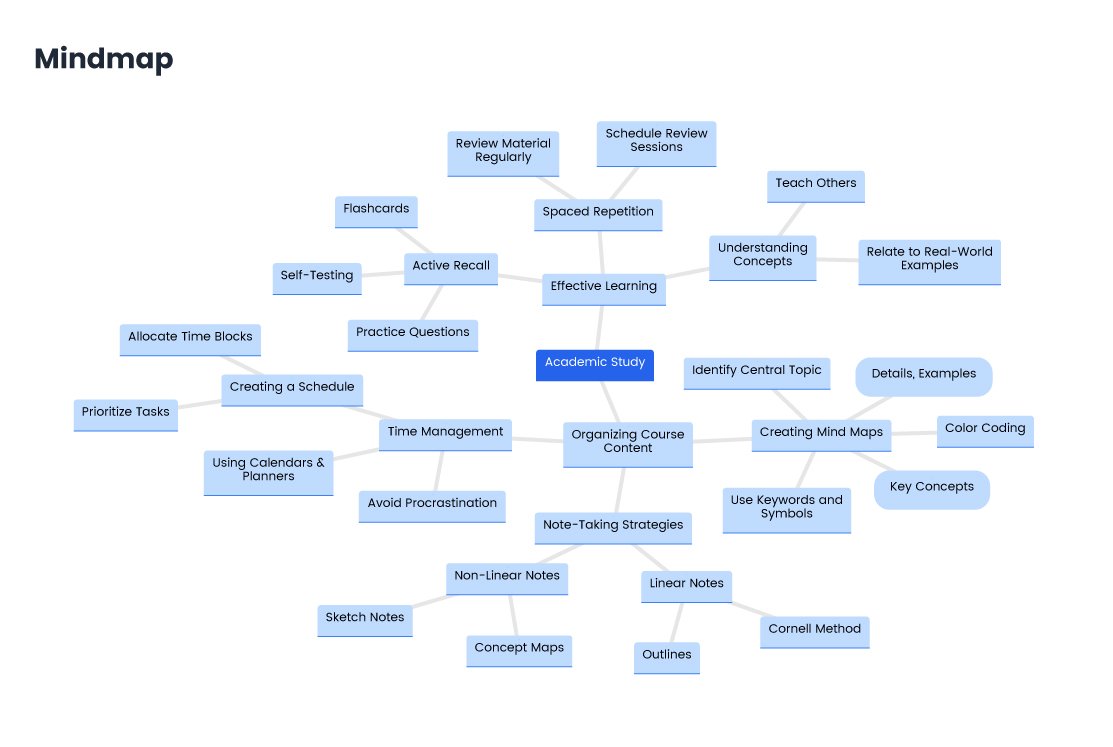
Mindmap
Met het mindmapdiagram van Mermaid kunt u hiërarchische ideeën visueel weergeven, te beginnen met een centraal concept en vertakkend naar gerelateerde onderwerpen. Het is ideaal voor brainstormen, schetsen en structureren van kennis.
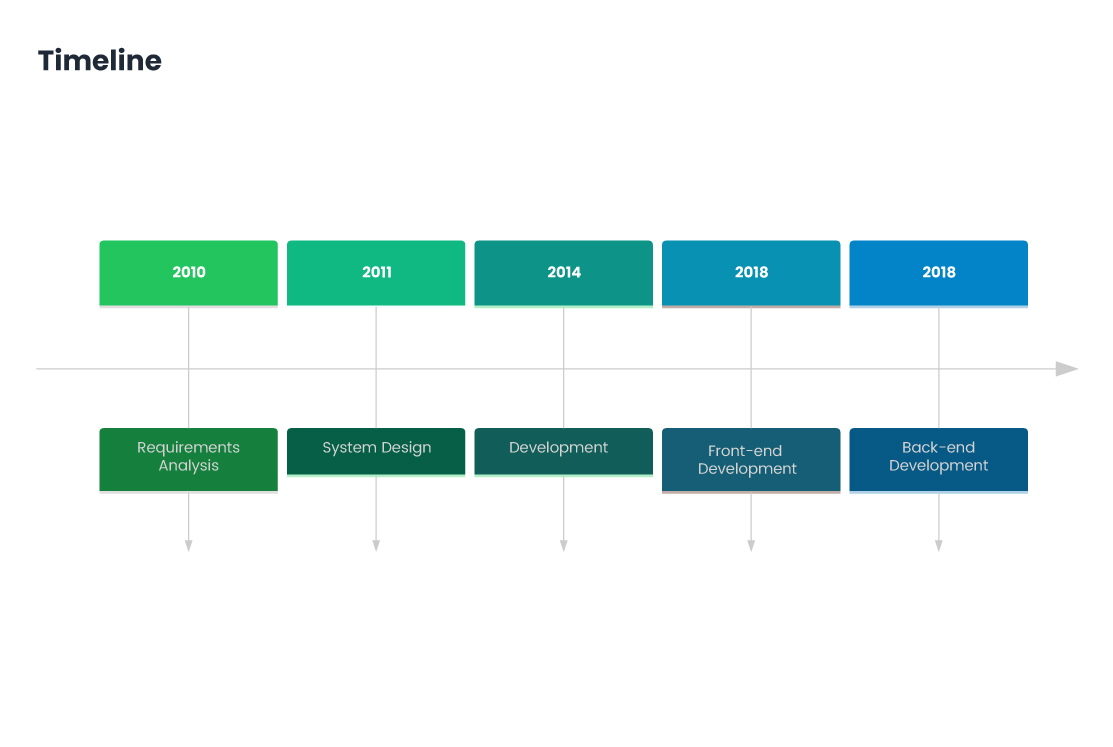
Tijdlijn
Het Tijdlijndiagram van Mermaid wordt gebruikt om gebeurtenissen of mijlpalen in chronologische volgorde te visualiseren. Het is ideaal voor het weergeven van projectplanningen, historische gebeurtenissen, productroadmaps of persoonlijke prestaties.
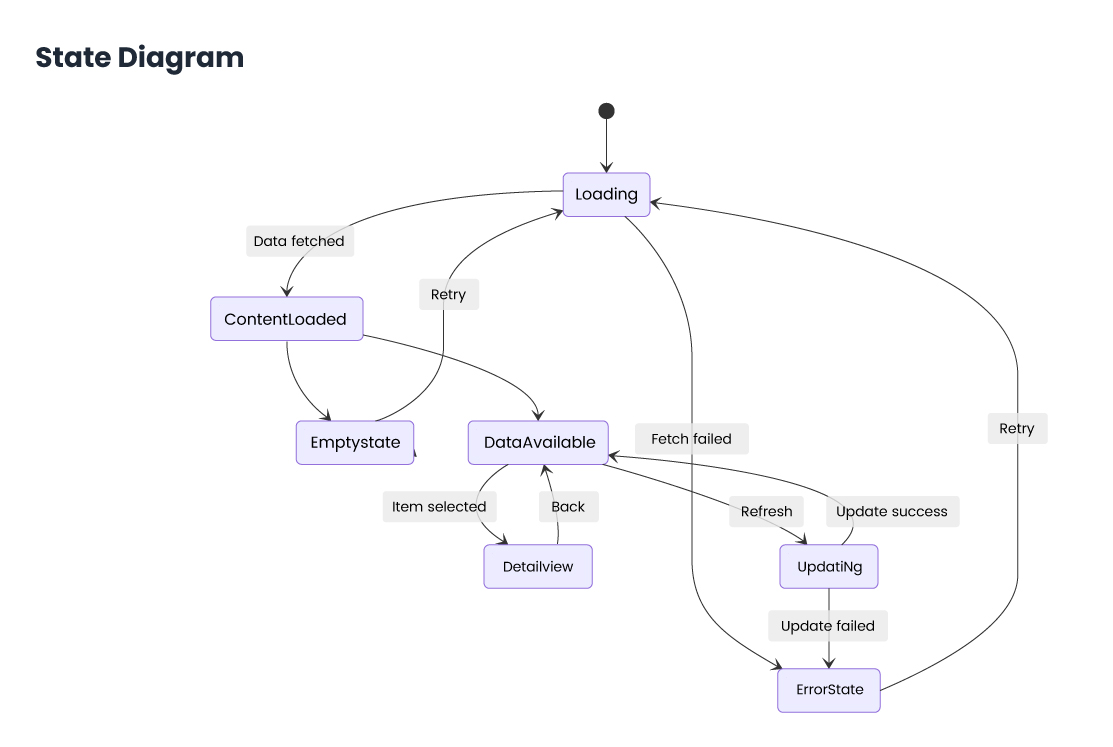
Statendiagram
Het Statendiagram van Mermaid wordt gebruikt om de verschillende staten weer te geven waarin een object of systeem zich kan bevinden, en de overgangen tussen die staten op basis van gebeurtenissen of voorwaarden.
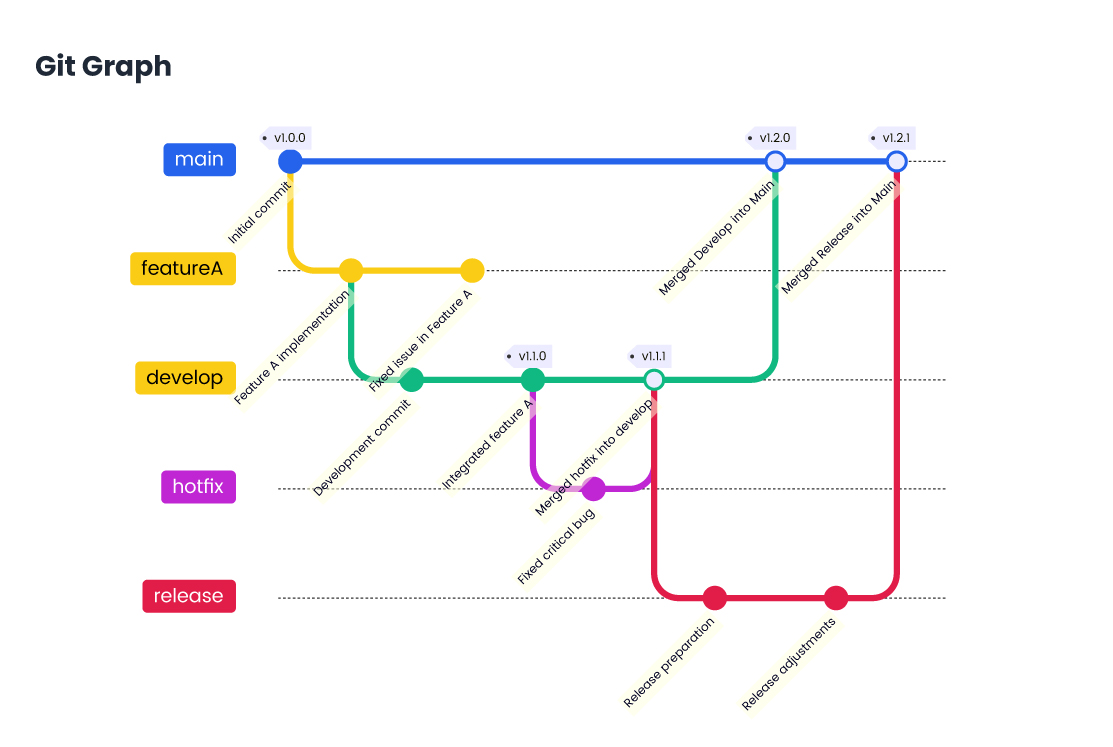
Git-grafiek
Het Git-grafiekdiagram van Mermaid wordt gebruikt om de commitgeschiedenis en vertakkingsstructuur van een Git-repository te visualiseren. Het toont commits, branches, merges en de relatie daartussen in een duidelijke, visuele indeling. Dit is handig voor het begrijpen van de ontwikkelingsworkflow, het volgen van feature-branches en het bekijken van de algehele Git-geschiedenis in een eenvoudige, gemakkelijk te lezen grafiek.
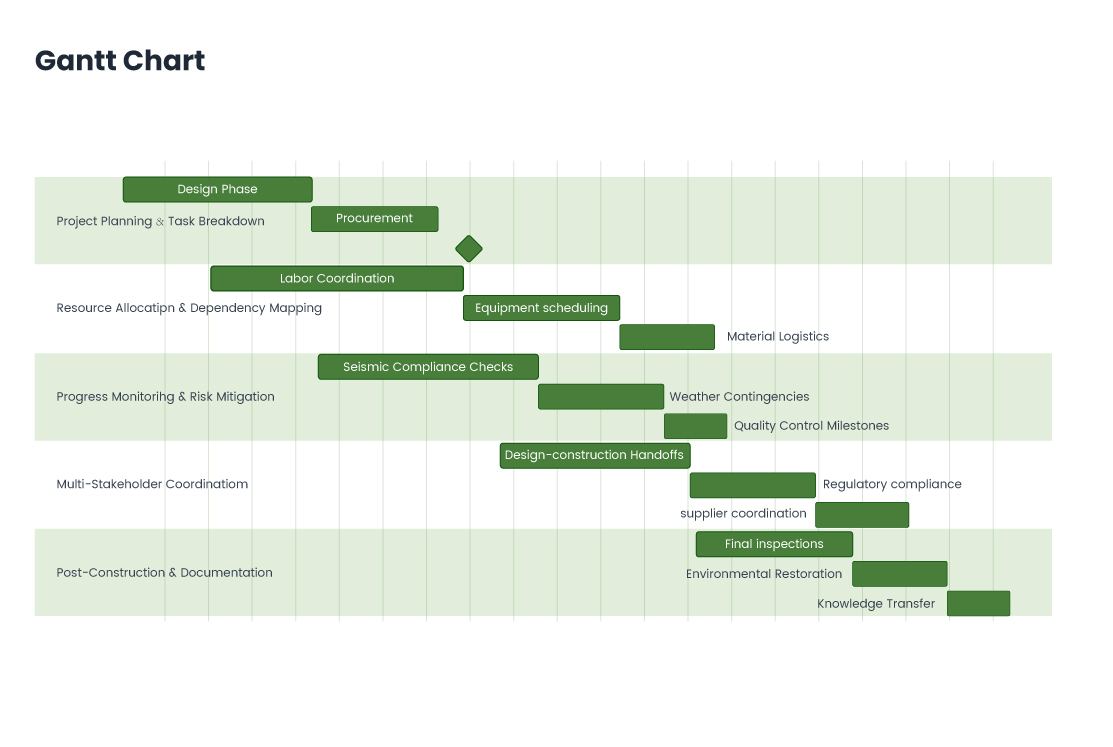
Gantt-diagram
De Gantt-grafiek van Mermaid wordt gebruikt om projecttijdlijnen en taakschema's weer te geven. Het toont visueel taken, hun duur, afhankelijkheden en mijlpalen langs een tijdlijn.
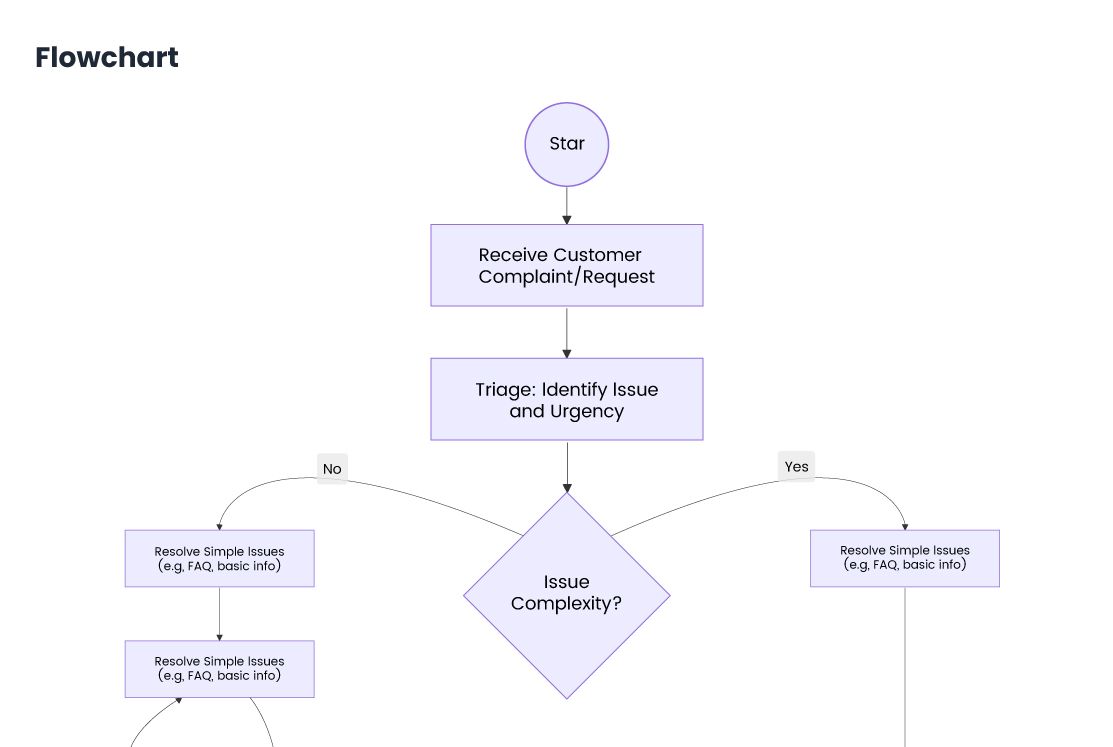
Stroomdiagram
Het stroomdiagram van Mermaid is een diagram dat wordt gebruikt om processen, workflows of besluitvormingsstappen visueel weer te geven. Het gebruikt knooppunten (stappen of acties) en pijlen (die de stroomrichting aangeven) om de volgorde van bewerkingen weer te geven.
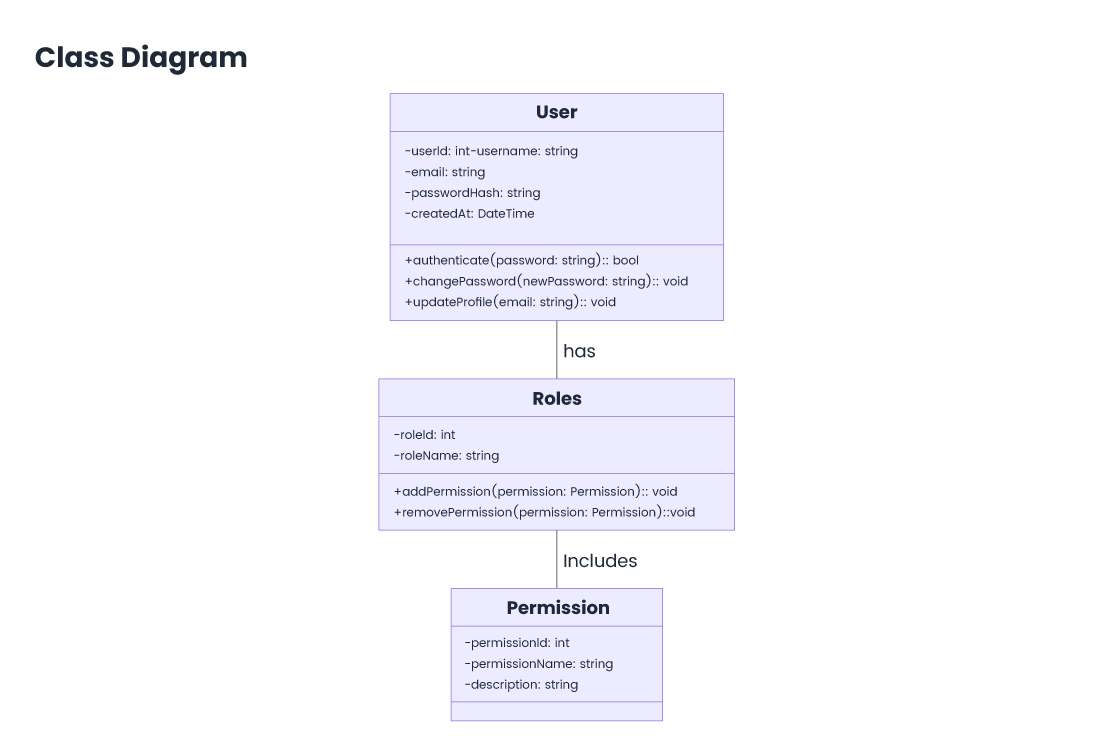
Klassendiagram
Het klassendiagram van Mermaid wordt gebruikt om de structuur van een systeem weer te geven door de klassen, attributen, methoden en relaties weer te geven. Het is ideaal voor objectgeoriënteerd ontwerp en helpt bij het visualiseren van klassenhiërarchieën, overerving, interfaces en associaties tussen objecten.
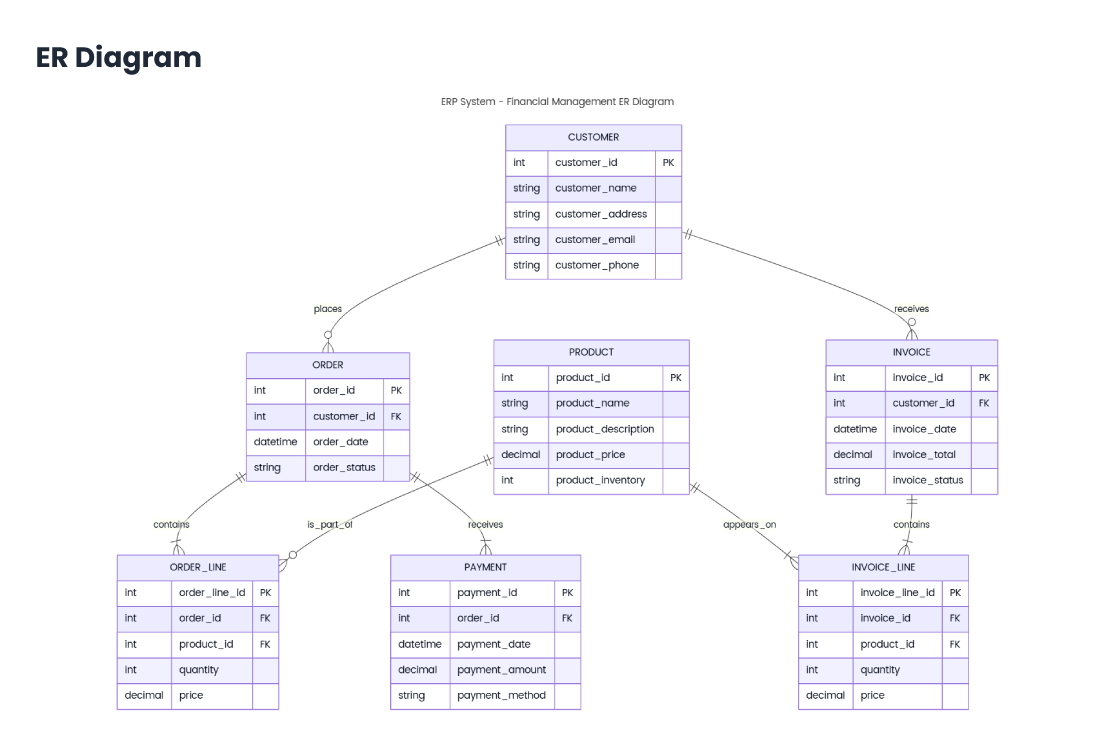
ER-diagram
Het Entity-Relationship (ER)-diagram van Mermaid wordt gebruikt om de relaties tussen entiteiten in een database te modelleren. Het geeft entiteiten, hun attributen en de relaties tussen hen visueel weer (zoals één-op-veel, veel-op-veel).
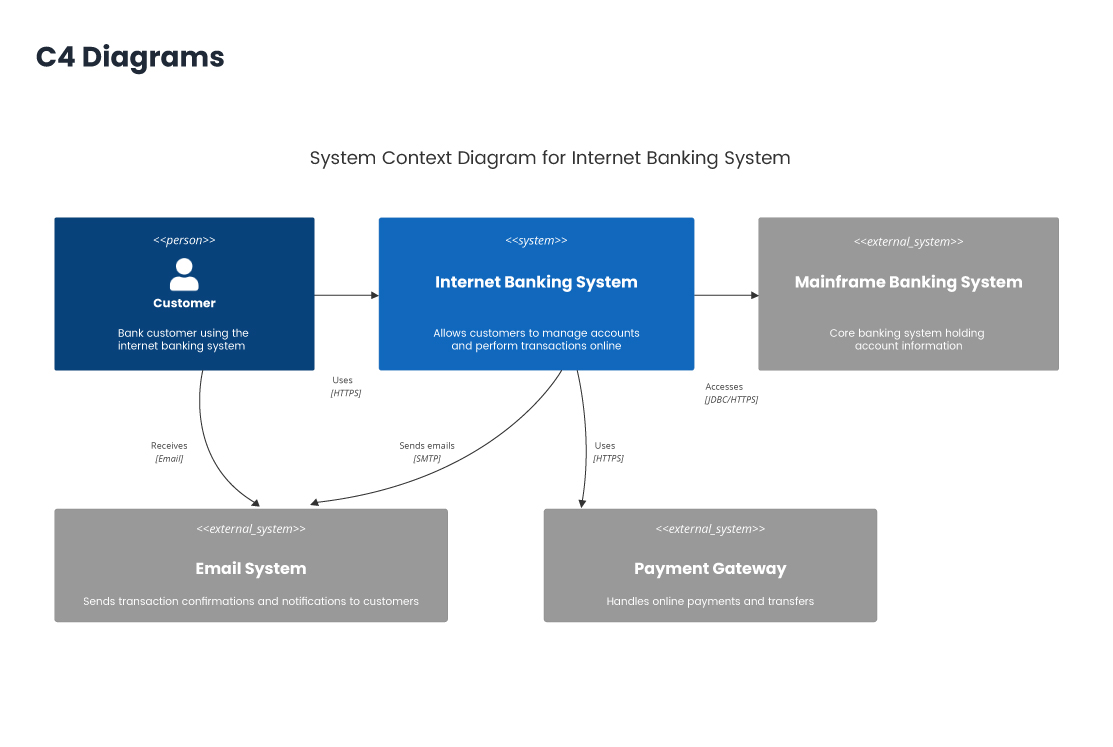
C4-diagrammen
De C4-diagrammen van Mermaid worden gebruikt om de architectuur van softwaresystemen op verschillende abstractieniveaus weer te geven. Ze bestaan uit vier hoofdtypen: Contextdiagram – Overzicht op hoog niveau van het systeem en zijn externe interacties. Containerdiagram – Toont de belangrijkste containers (applicaties of databases) waaruit het systeem bestaat. Componentdiagram – Geeft details van de componenten binnen een container. Codediagram – Toont de interne structuur van componenten op klasseniveau.
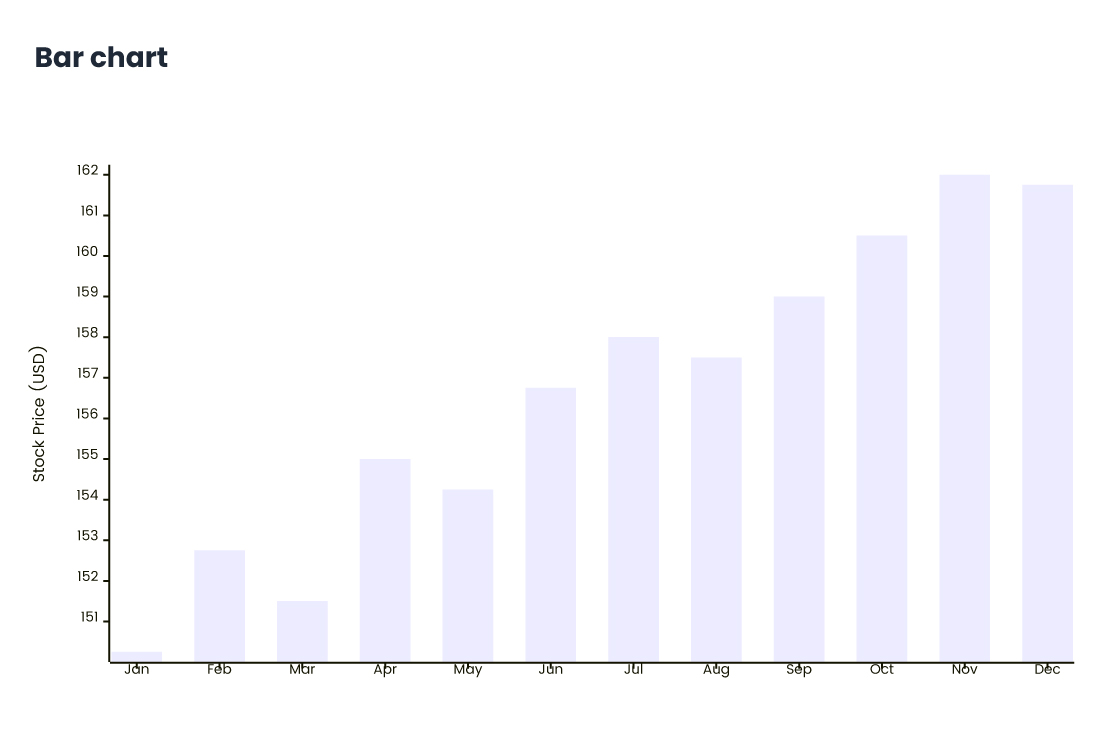
Staafdiagram
Het Staafdiagram van Mermaid wordt gebruikt om gegevens te visualiseren in de vorm van rechthoekige staven, waarbij de lengte van elke staaf evenredig is met de waarde die deze vertegenwoordigt. Het is ideaal voor het vergelijken van hoeveelheden over verschillende categorieën of groepen.
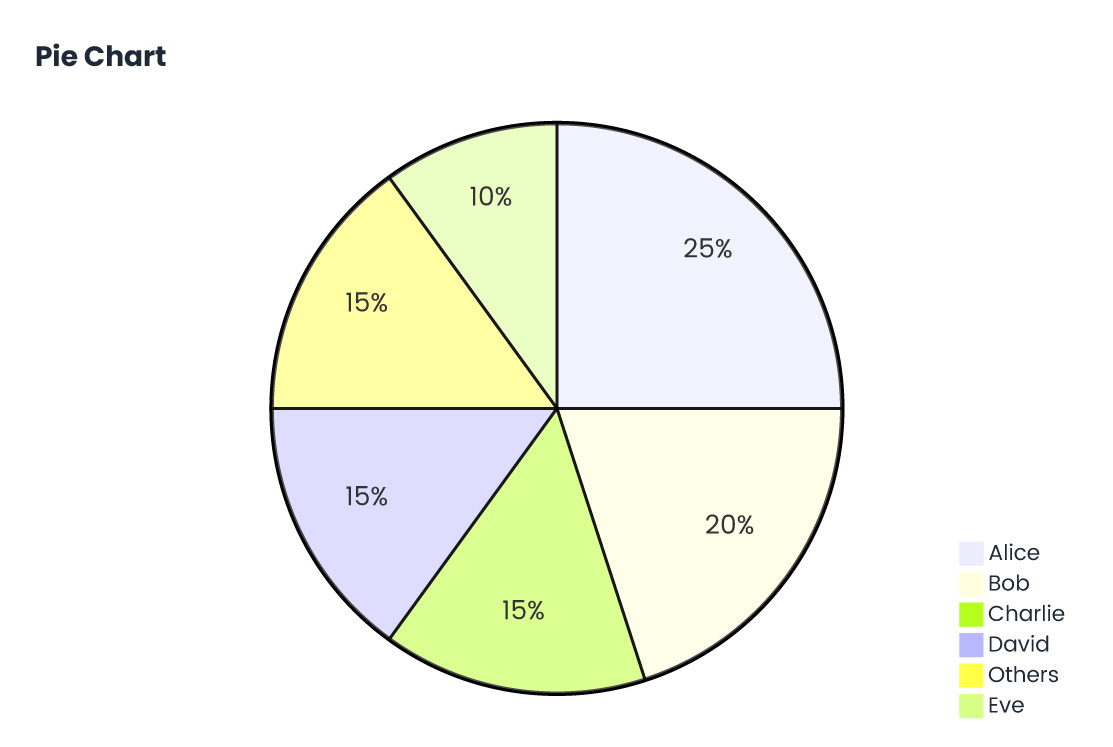
Taartdiagram
Het taartdiagram van Mermaid wordt gebruikt om gegevens weer te geven als segmenten van een cirkel, waarbij elk segment een evenredigheid van het geheel vertegenwoordigt. Het is ideaal voor het weergeven van relatieve percentages of delen van een totaal. Hoewel de taartdiagramfunctionaliteit van Mermaid eenvoudig is, kan het effectief de gegevensverdeling in een heldere en visueel aantrekkelijke indeling communiceren.
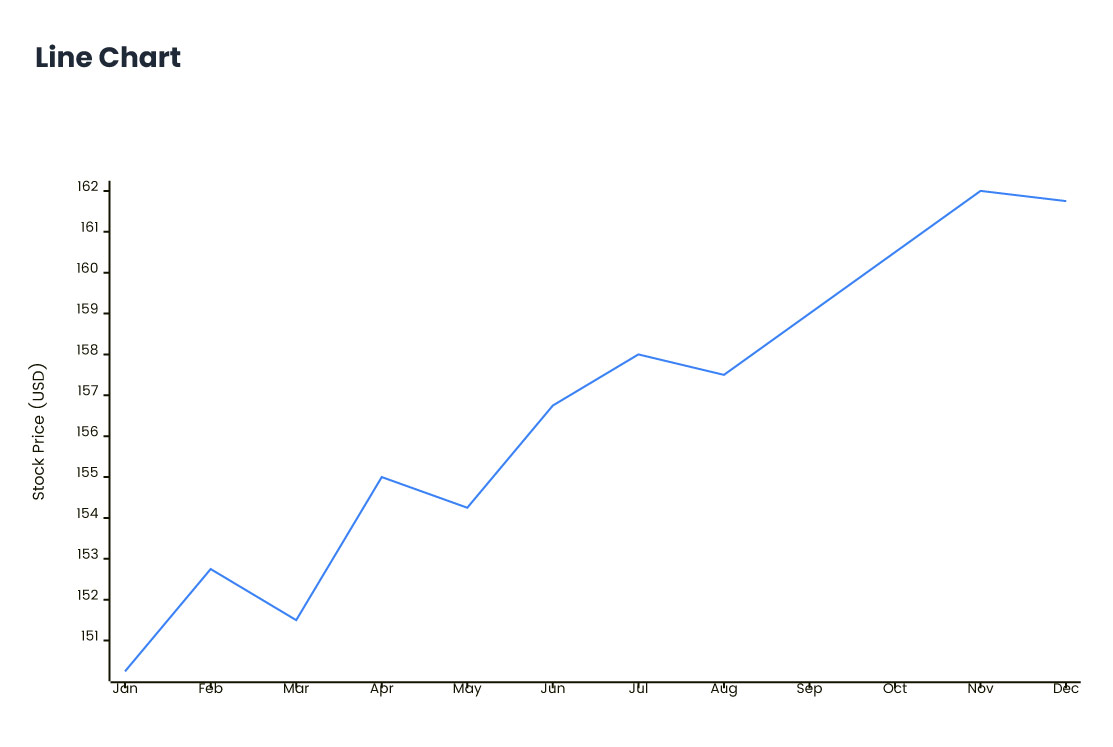
Lijndiagram
Het lijndiagram van Mermaid wordt gebruikt om datapunten weer te geven die zijn verbonden door rechte lijnen, ideaal voor het weergeven van trends in de loop van de tijd of continue gegevens. Het wordt vaak gebruikt voor het visualiseren van veranderingen in variabelen, zoals verkoop of temperatuur, over een tijdreeks. De lijndiagrammen van Mermaid zijn eenvoudig te maken, waardoor ze geweldig zijn voor het volgen van voortgang of het vergelijken van meerdere datasets.
Combo
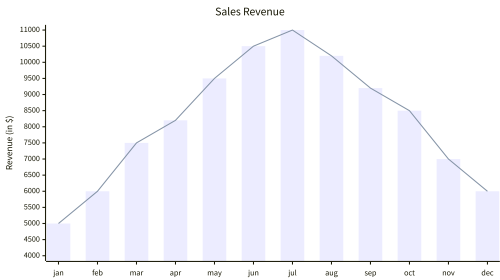
Een staafdiagram met een lijndiagram, ook wel een combo-diagram genoemd, combineert staaf- en lijngrafieken in één visualisatie. Staven vertegenwoordigen doorgaans discrete gegevenscategorieën, terwijl de lijn trends of vergelijkingen laat zien. Dit diagram met dubbele as is ideaal voor het benadrukken van relaties tussen twee datasets, zoals volume en groei in de loop van de tijd.
Kwadrantendiagram
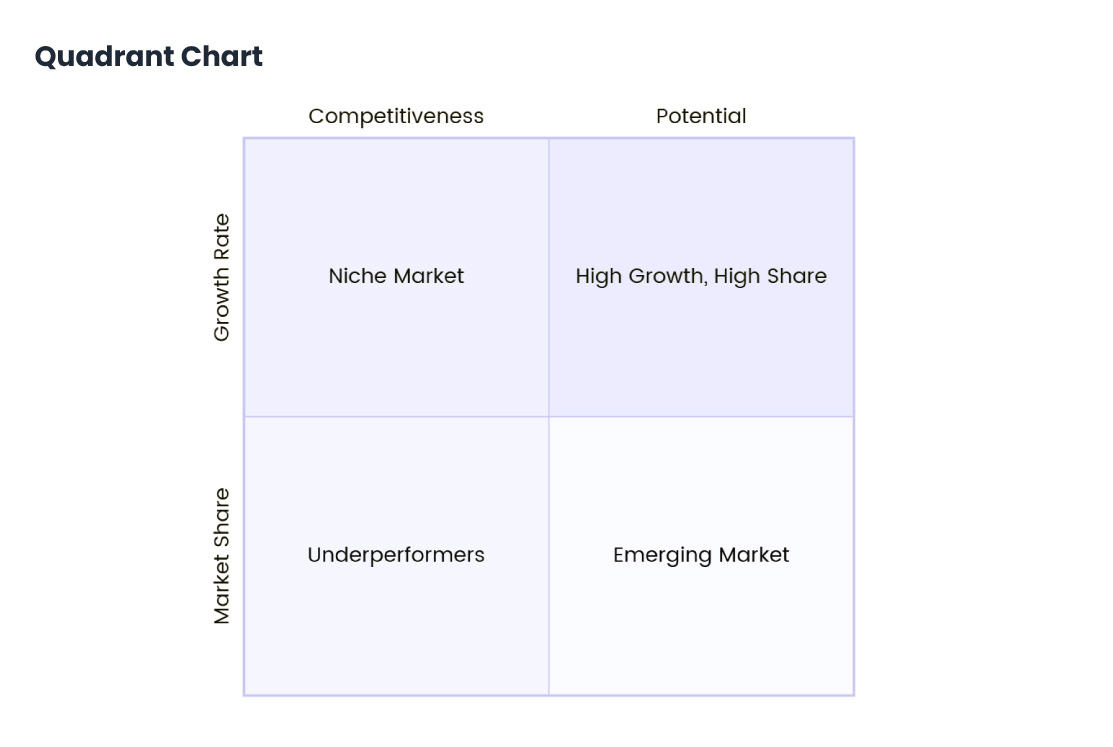
Mermaid biedt geen native ondersteuning voor kwadrantendiagrammen, maar u kunt een kwadrantendiagram visueel simuleren door spreidingsdiagrammen of aangepaste stroomdiagrammen met aangepaste positionering van elementen te gebruiken. Een kwadrantdiagram verdeelt een grafiek doorgaans in vier secties (kwadranten) om twee variabelen weer te geven, vaak gebruikt voor zaken als concurrentiepositionering of SWOT-analyse.
Sankey
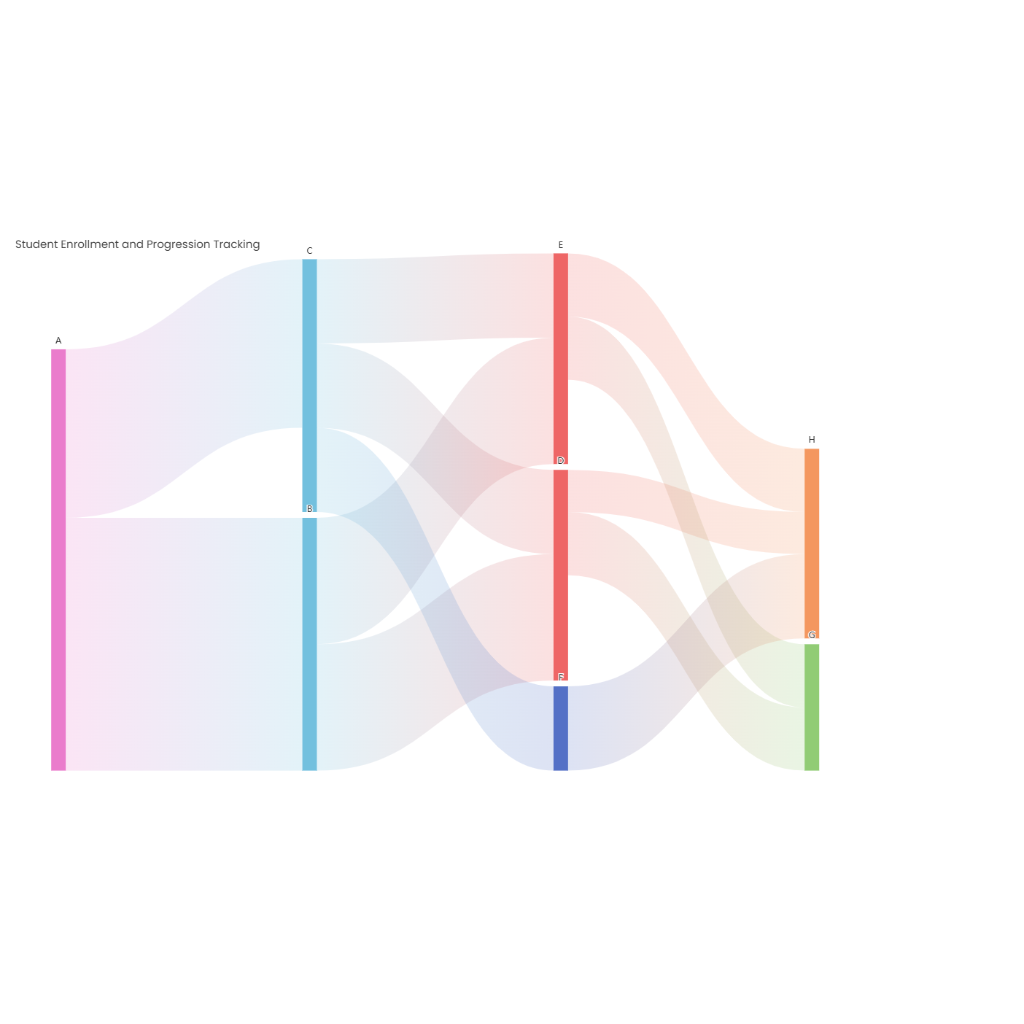
Een Sankey-diagram is een stroomdiagram waarbij de breedte van de pijlen evenredig is met de stroomhoeveelheid. Het wordt vaak gebruikt om energie-, materiaal- of kostentransfers tussen processen te visualiseren, waarbij inefficiënties of belangrijke stromen in een systeem worden benadrukt.

Structuurdiagram
Een structuurdiagram, met behulp van een top-down (TD) stroomdiagramstijl, geeft visueel de hiërarchische organisatie van een systeem weer. Het breekt complexe processen op in kleinere modules van boven (hoofdmodule) naar beneden (submodules). Dit helpt relaties, verantwoordelijkheden en de controlestroom te verduidelijken, waardoor systeemontwerp, begrip en foutopsporing efficiënter en gestructureerder worden.
Blokschema
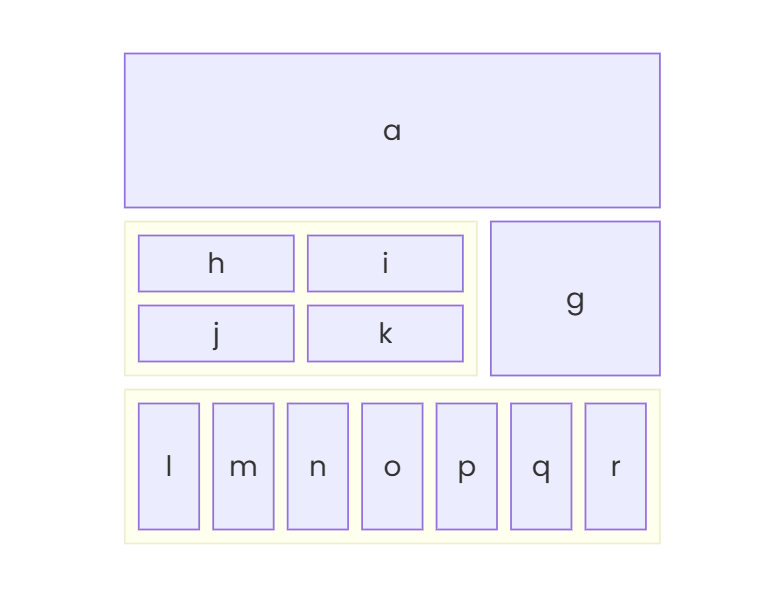
Een blokschema is een vereenvoudigde visuele weergave van een systeem, proces of concept met behulp van gelabelde blokken die zijn verbonden door lijnen. Elk blok vertegenwoordigt een component of functie, terwijl de lijnen relaties of gegevensstroom weergeven. Het wordt vaak gebruikt in de techniek, programmering en het bedrijfsleven om de systeemstructuur en werking duidelijk te illustreren.
Functies van AI Mermaid Chart Maker

Automatische grafiekcreatie

Slimme lay-outoptimalisatie

Meerdere grafiektypen

Real-time grafiekupdates

Naadloze toolintegratie

Geen installatie vereist
Hoe AI Mermaid Chart Maker te gebruiken
01
Voer uw gegevens in
Voer de gegevens in die in de Mermaid-grafiek moeten worden gevisualiseerd.
02
Selecteer diagramtype
Kies het type Mermaid-grafiek (bijv. stroomdiagram, Gantt-diagram).
03
Genereer met AI
Klik op 'Genereren met AI' om direct uw diagram te maken.
04
Pas het diagram aan
Bewerk kleuren, labels en ontwerpelementen.
05
Download en deel
Download of deel uw Mermaid-diagram eenvoudig.

Direct grafieken maken
Met AI worden Mermaid-grafieken direct gegenereerd. Voer eenvoudig uw gegevens in en binnen enkele seconden heeft u een professionele grafiek klaar voor gebruik, waardoor u tijd en moeite bespaart.

Slimme aanpassing
AI optimaliseert op intelligente wijze de structuur van uw Mermaid-grafiek. Het past automatisch het ontwerp aan, zodat uw grafiek helder, visueel aantrekkelijk en gemakkelijk te begrijpen is.
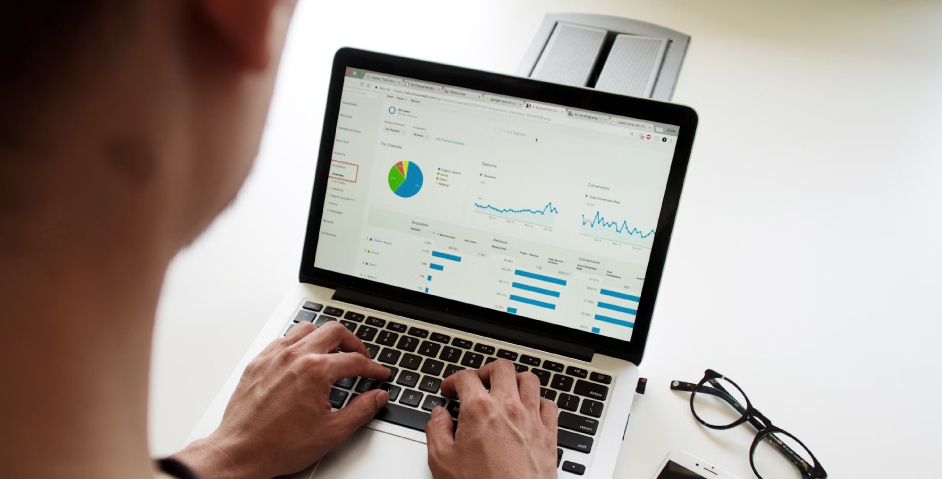
Meerdere grafiektypen
Of u nu een stroomdiagram, Gantt-diagram of sequentiediagram nodig hebt, onze AI-tool ondersteunt verschillende Mermaid-grafiektypen, waardoor u de flexibiliteit hebt om de beste visualisatie voor uw gegevens te kiezen.

Eenvoudige aanpassing
Pas uw Mermaid-grafieken eenvoudig aan. Pas kleuren, labels en stijlen aan uw behoeften aan, zodat u de grafiek kunt personaliseren zonder technische vaardigheden.

Naadloze integratie
De door AI gegenereerde Mermaid-grafieken kunnen eenvoudig worden ingebed in platforms zoals GitHub, Markdown en meer. Deze naadloze integratie maakt het gemakkelijk om uw grafieken te delen voor samenwerking.
Geen installatie vereist
U hebt geen extra installatie nodig. Mermaid-grafieken worden rechtstreeks in uw browser gegenereerd, waardoor er geen externe servers of software-installatie nodig is.
Veelgestelde vragen (FAQ's) voor AI Mermaid Diagram Maker
01
Hoe genereer ik een Mermaid diagram met AI?
Voer eenvoudig beknopte tekstcommando's in, en de AI-tool genereert automatisch Mermaid diagrammen, waardoor processen, taken of systeemarchitecturen moeiteloos worden gevisualiseerd. Zo kunt u snel efficiënte diagrammen maken.
02
Hoe genereer ik een Mermaid diagram met AI?
Voer eenvoudig beknopte tekstcommando's in, en de AI-tool genereert automatisch Mermaid diagrammen, waardoor processen, taken of systeemarchitecturen moeiteloos worden gevisualiseerd. Zo kunt u snel efficiënte diagrammen maken.
03
Welke soorten Mermaid diagrammen ondersteunt de tool?
Onze tool ondersteunt het genereren van verschillende soorten Mermaid diagrammen, waaronder stroomdiagrammen, Gantt-diagrammen, sequencediagrammen, klassendiagrammen, statemachinediagrammen en meer, die inspelen op verschillende behoeften en uitgebreide visualisatieondersteuning bieden.
04
Kan ik het door AI gegenereerde Mermaid diagram bewerken?
Ja, door AI gegenereerde Mermaid diagrammen zijn volledig bewerkbaar, waardoor u kleuren, labels, lay-outs en meer kunt aanpassen aan uw behoeften, zodat het diagram past bij uw project of persoonlijke voorkeuren.
05
Hoe exporteer ik door AI gegenereerde Mermaid Diagrammen?
Door AI gegenereerde Mermaid diagrammen kunnen eenvoudig worden geëxporteerd in PNG-, SVG- of Mermaid-formaat, waardoor ze eenvoudig opnieuw te gebruiken zijn in andere documenten of platforms. Of het nu gaat om het delen van projecten, het inbedden op websites of het integreren in rapporten, Mermaid diagrammen ondersteunen efficiënt uw datavisualisatiebehoeften.
06
Hoe helpt het door AI gegenereerde Mermaid diagram bij projectmanagement?
Door AI gegenereerde Mermaid diagrammen, zoals Gantt-diagrammen en stroomdiagrammen, helpen teams om taken duidelijk te definiëren, de voortgang in realtime te volgen en projectmanagementprocessen te stroomlijnen. Met Mermaid diagrammen kunnen teams de samenwerking stimuleren, de tijdige afronding van projecten garanderen en de besluitvorming optimaliseren, wat uiteindelijk de productiviteit en het slagingspercentage van projecten verbetert.
07
Hoe gebruik ik Mermaid diagrammen op GitHub?
U kunt door AI gegenereerde Mermaid diagrammen insluiten in uw GitHub README-bestanden om de visualisatie van uw projectdocumentatie te verbeteren. Met Mermaid diagrammen worden projectworkflows, structuren en gegevens intuïtiever, waardoor teams en ontwikkelaars projectdetails beter kunnen begrijpen en communiceren.
08
Welke industrieën kunnen profiteren van door AI gegenereerde Mermaid diagrammen?
Door AI gegenereerde Mermaid diagrammen zijn toepasbaar in verschillende industrieën, waaronder softwareontwikkeling, projectmanagement, marketing, productontwerp en onderwijs. Ze bieden efficiënte ondersteuning voor datavisualisatie, waardoor workflowmanagement, projecttracking, data-analyse en besluitvorming worden verbeterd. Mermaid diagrammen verbeteren de productiviteit en beslissingskwaliteit aanzienlijk in elke industrie.
09
Kan ik Mermaid diagrammen integreren in andere tools?
Ja, door AI gegenereerde Mermaid diagrammen kunnen naadloos worden geïntegreerd in tools zoals Markdown, Jira en Notion, waardoor samenwerking en delen eenvoudiger worden. Door Mermaid diagrammen in documenten of platforms in te sluiten, kunt u moeiteloos complexe gegevens en workflows presenteren, waardoor de efficiëntie, communicatie en besluitvorming worden verbeterd.
10
Hoe zorgt AI voor de nauwkeurigheid van het Mermaid diagram?
Onze AI-tool analyseert op intelligente wijze de gebruikersinvoer en optimaliseert automatisch de lay-out en structuur, waardoor de nauwkeurigheid van de gegenereerde Mermaid diagrammen wordt gegarandeerd. Aangedreven door geavanceerde algoritmen, past de AI-diagramgenerator het diagram automatisch aan op basis van gegevens en workflows, waardoor een efficiënte en nauwkeurige visuele weergave wordt gegarandeerd.
11
Kan ik aangepaste stijlen gebruiken in mijn Mermaid diagram?
Ja, u kunt aangepaste stijlen gebruiken in Mermaid diagrammen om het uiterlijk aan te passen, inclusief kleuren, lettertypen, knooppuntgroottes en meer, volledig aangepast aan uw behoeften. Met de AI-diagramgenerator kunt u eenvoudig gepersonaliseerde ontwerpen maken die aansluiten bij uw projectstijl en brandingvereisten.
12
Heb ik programmeerkennis nodig om door AI gegenereerde Mermaid diagrammen te gebruiken?
Er is geen programmeerkennis vereist om door AI gegenereerde Mermaid diagrammen te gebruiken. Voer eenvoudig beknopte tekstcommando's in, en de AI genereert automatisch prachtige Mermaid diagrammen, waardoor het gemakkelijk te gebruiken is voor gebruikers van alle vaardigheidsniveaus.
13
Worden Mermaid diagrammen in realtime bijgewerkt?
Ja, u kunt de invoergegevens bijwerken en de AI ververst direct de gegenereerde Mermaid diagrammen, zodat deze altijd gesynchroniseerd zijn met de nieuwste gegevens voor een nauwkeurige visuele weergave.
