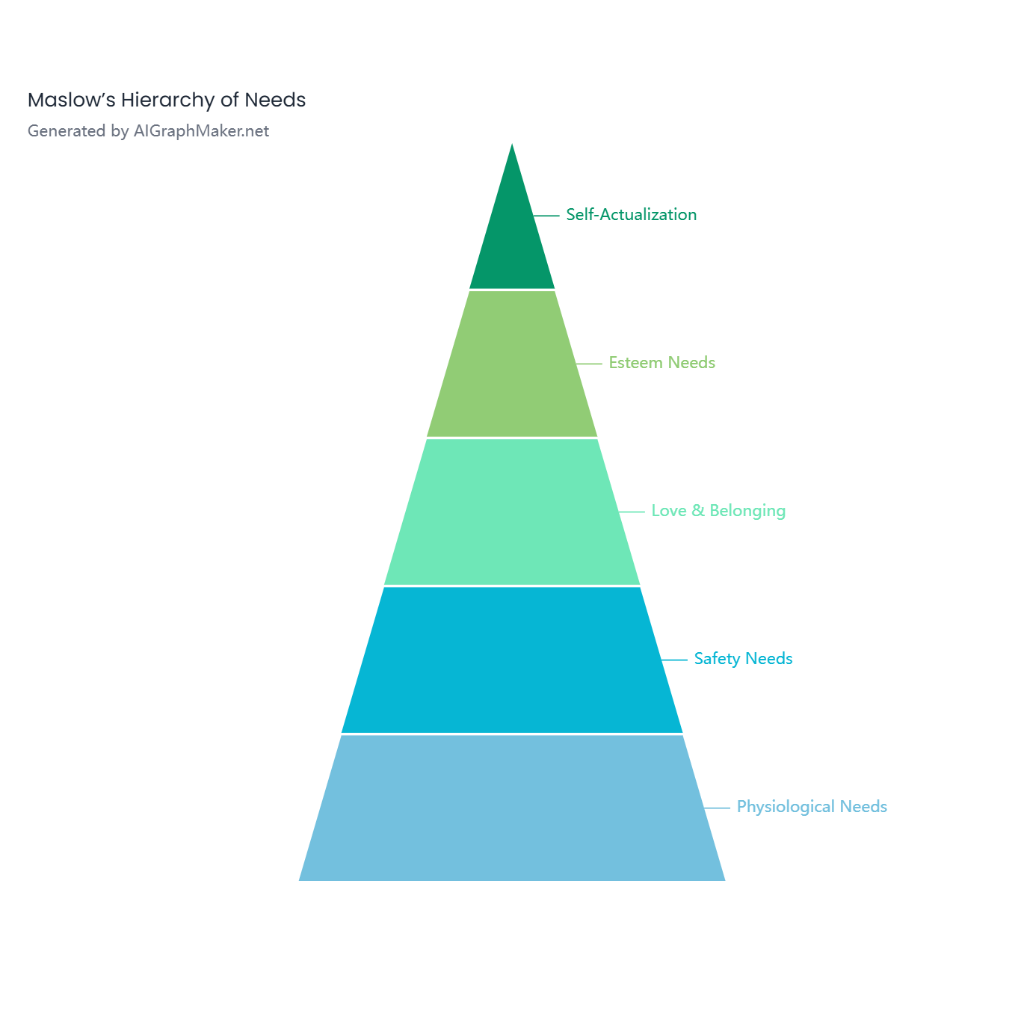
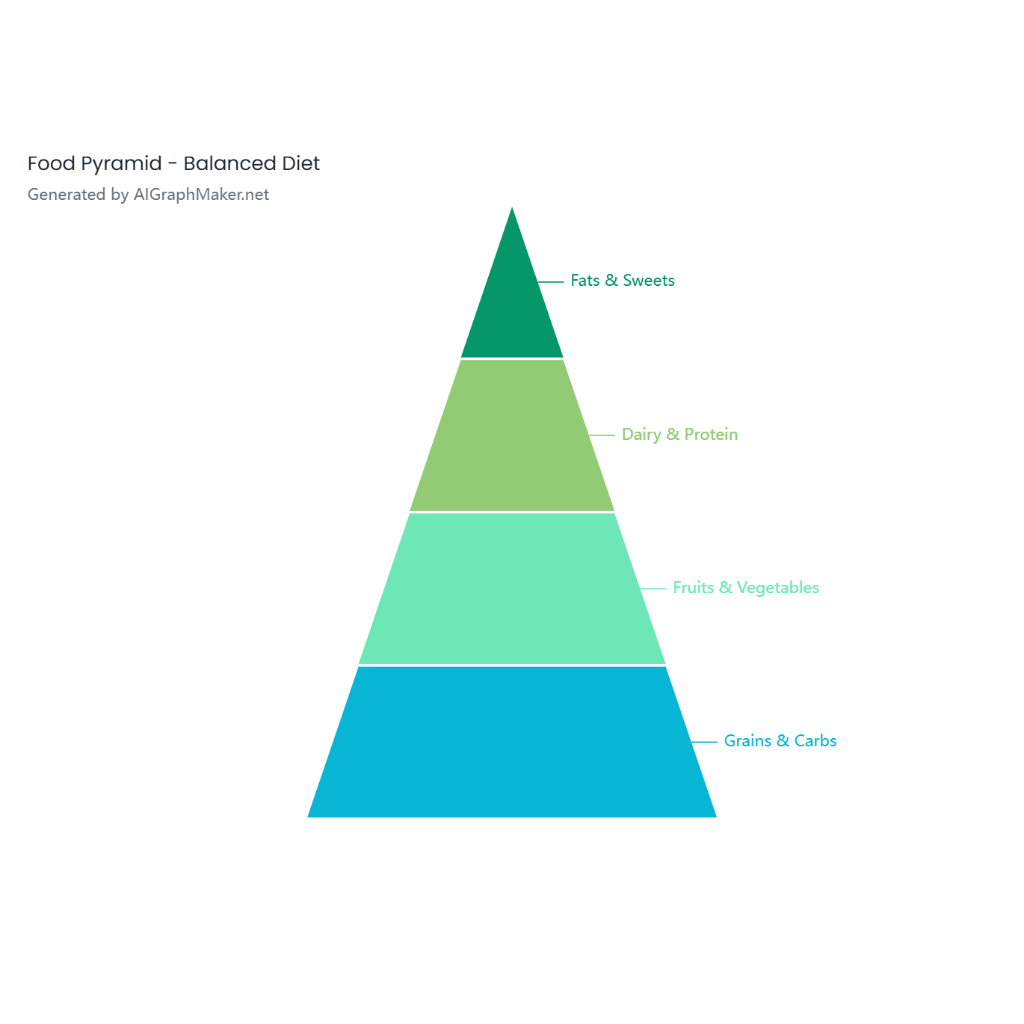
Create a corporate hierarchy pyramid chart. The pyramid has four levels from top to bottom: CEO (1%), Executives & Directors (4%), Managers (15%), and Employees (80%). Use a gradient color scheme from dark at the top to light at the bottom. Label each section and add a title: 'Corporate Hierarchy Structure'.
Description
## Description
This corporate hierarchy pyramid chart visually represents the organizational structure of a typical company. The pyramid is divided into four distinct levels, each corresponding to a different tier of the corporate hierarchy. The chart uses a gradient color scheme, transitioning from dark at the top to light at the bottom, to emphasize the decreasing number of personnel as you move up the hierarchy.
- **CEO (1%)**: At the very top of the pyramid is the Chief Executive Officer (CEO), who holds ultimate responsibility for the company's operations and strategy. The CEO makes high-level decisions and represents the company to stakeholders and the public.
- **Executives & Directors (4%)**: This level includes other top executives and board directors who assist the CEO in making strategic decisions and oversee various aspects of the business such as finance, operations, and marketing.
- **Managers (15%)**: Middle management forms this tier, consisting of department heads and team leaders who are responsible for implementing the strategies set by upper management and overseeing day-to-day operations.
- **Employees (80%)**: The largest segment of the pyramid comprises the general employees who carry out the day-to-day tasks and operations that drive the business forward. This includes a wide range of roles from administrative staff to technical experts and customer service representatives.
Each section is clearly labeled with its corresponding title and percentage of the total workforce. The gradient color scheme helps to visually distinguish each level and reinforces the hierarchical nature of the organization.
## Benefits
This pyramid chart offers a clear and concise visual representation of the corporate hierarchy, making it easier for stakeholders to understand the structure and decision-making flow within the organization. It highlights the small number of top decision-makers at the top and the large number of employees at the base, illustrating how responsibilities and authority are distributed throughout the company.
The chart can be a useful tool for new employees to grasp the organizational structure and for managers to understand their position within the broader framework of the company. It also provides insights into the potential career progression paths within the organization.
