Git Graph in Project Management: Tracking Development Milestones
Description
A Git Graph serves as a powerful visual tool in project management, enabling teams to track development milestones, collaborate efficiently, and maintain version control integrity. By mapping commit histories, branch workflows, and merge events, Git Graphs provide a clear timeline of a project’s evolution, aligning technical progress with project management objectives. Below is a detailed description of its applications and benefits:
Core Components of Git Graph in Project Management
A Git Graph typically visualizes:
- Branches: Divergent lines representing feature development (e.g.,
feature/new-login), bug fixes (hotfix/security-issue), or release cycles (release/v2.0). - Commits: Timestamped nodes documenting code changes, each linked to specific tasks (e.g., “Implement OAuth 2.0,” “Fix payment gateway bug”).
- Merges: Convergence points where branches are integrated (e.g., merging
developintomainfor a production release). - Milestones: Critical project phases (e.g., “Alpha Testing,” “Launch”) marked alongside the graph to correlate code progress with delivery goals.
Key Uses in Development Workflows
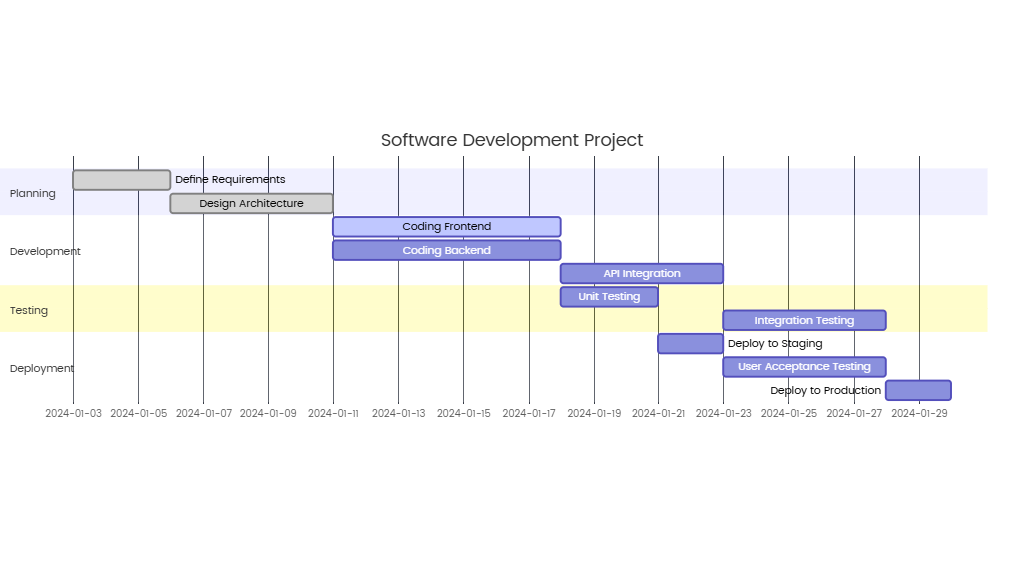
1. Milestone Tracking & Timeline Alignment
- Example: A project with milestones like “User Authentication” (Week 2), “API Integration” (Week 4), and “Final Testing” (Week 6) can use Git Graphs to:
- Track whether feature branches (e.g.,
auth-service) are merged intodevelopon schedule. - Identify delays in critical paths (e.g., a blocked
database-migrationbranch affecting API progress).
- Track whether feature branches (e.g.,
- Tool Integration: Platforms like GitHub, GitLab, or Bitbucket auto-generate Git Graphs linked to issue trackers (e.g., Jira, Trello), allowing managers to cross-reference code commits with task completion.
2. Conflict Resolution & Branch Management
- Visual Debugging: Git Graphs highlight parallel development paths and merge conflicts (e.g., overlapping changes in
frontendandbackendbranches). - Best Practices:
- Use feature branches for isolated development to prevent contamination of the
mainbranch. - Employ pull requests (PRs) with code reviews before merging, documented as merge events in the graph.
- Use feature branches for isolated development to prevent contamination of the
3. Collaboration & Accountability
- Team Transparency: Developers can visualize how their contributions fit into the broader project timeline. For example:
- A junior developer’s
bugfix/responsive-designbranch is merged after review, contributing to the “UI Stability” milestone. - A lead engineer’s
refactor/databasebranch shows iterative commits over weeks, leading to improved performance.
- A junior developer’s
- Accountability: Commits are tagged with contributor names, making it easy to identify bottlenecks (e.g., a single developer handling too many critical merges).
4. Release Management & Version Control
- Release Branches: Dedicated branches (e.g.,
release/2024Q3) are created for final testing, with the Git Graph showing all changes included in the release. - Rollback Insights: In case of issues, the graph helps trace commits since the last stable release (e.g., identifying which commit introduced a regression).
Benefits for Project Managers
- Risk Mitigation:
- Early detection of delayed branches (e.g., a
machine-learning-modelbranch falling behind schedule for an AI milestone). - Proactive conflict resolution before merges into
main, reducing post-release bugs.
- Early detection of delayed branches (e.g., a
- Resource Allocation:
- Identify overburdened team members by analyzing commit frequency per developer.
- Balance workloads by reassigning tasks linked to stagnant branches (e.g.,
feature/report-generator).
- Stakeholder Communication:
- Share simplified Git Graphs with non-technical stakeholders to demonstrate progress (e.g., “All Phase 1 features merged into
main”). - Use the graph to explain delays (e.g., “Merge conflicts in
payment-gatewaybranch caused a 2-day setback”).
- Share simplified Git Graphs with non-technical stakeholders to demonstrate progress (e.g., “All Phase 1 features merged into
Tools and Visualization Techniques
- Native Git Clients:
- GitHub Desktop: Interactive graph showing branch histories and merges.
- GitKraken: Advanced visualization with commit hashes, tags, and release notes.
- CI/CD Integration:
- Tools like Jenkins or CircleCI update Git Graphs automatically after successful builds, linking deployment pipelines to code milestones.
- Custom Scripts:
- Use
git log --graphin the command line for text-based graphs, or generate SVG/PNG plots with tools likegit-floword3-graph.
- Use
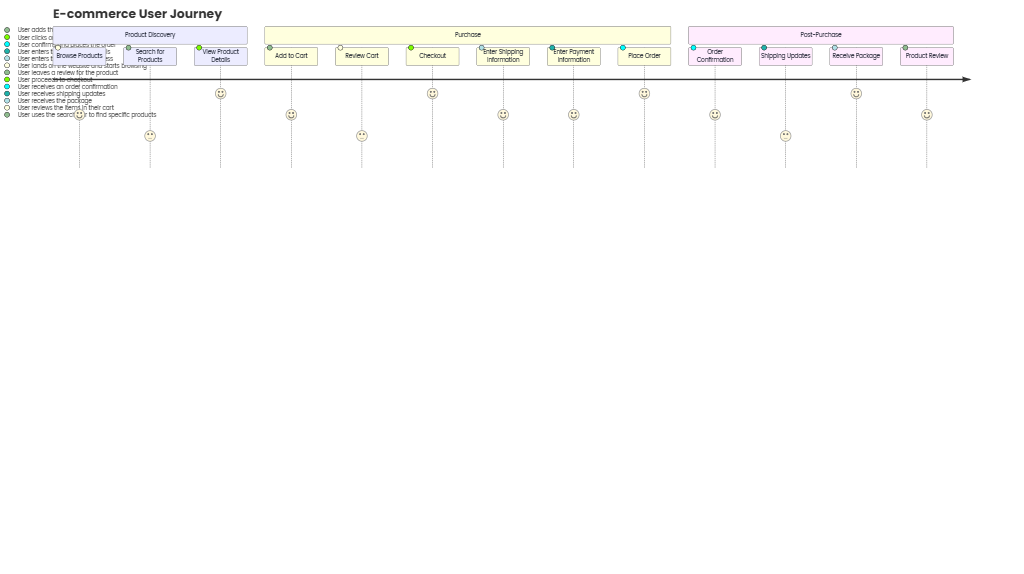
Example Workflow: E-commerce Platform Development
- Milestone: User Registration System
- Branches:
feature/user-registration(frontend) andapi/user-auth(backend). - Commits:
- Frontend: “Add form validation” (Day 3), “Integrate with React” (Day 5).
- Backend: “Implement JWT authentication” (Day 4), “Test API endpoints” (Day 6).
- Merge: Both branches are merged into
developon Day 7, marking the milestone completion.
- Branches:
- Milestone: Launch v1.0
- Release Branch:
release/v1.0is created fromdevelopon Day 14. - Hotfixes: A critical bug in
payment-processingis fixed inhotfix/payment-bug, merged intorelease/v1.0on Day 16. - Final Merge:
release/v1.0is merged intomainon Day 18, with the Git Graph showing a clean release timeline.
- Release Branch:
Conclusion
A Git Graph is more than a technical tool; it’s a project management asset that bridges the gap between code execution and delivery goals. By visualizing development milestones, branch dependencies, and team contributions, it enhances collaboration, minimizes risks, and keeps projects on track. For Agile or Waterfall teams alike, integrating Git Graphs into workflows ensures transparency, accountability, and efficient tracking of technical progress.
编辑
分享
将描述精简到200字
推荐一些Git Graph的应用案例
分享一些关于项目管理的最佳实践