Added on:
May 07, 2025
User Prompt
Git Graph for Historical Analysis: Understanding Project Evolution Over Time
Description
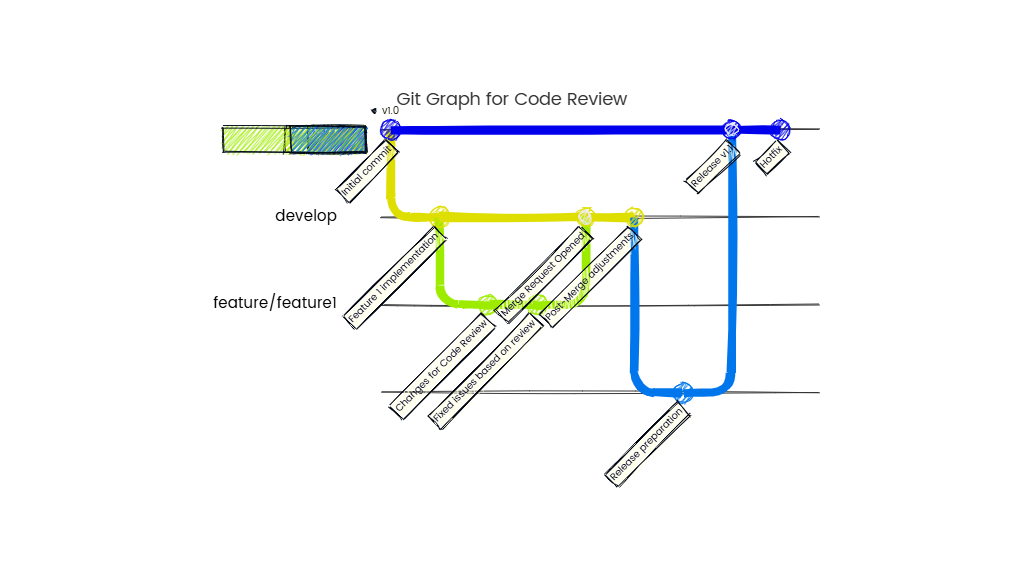
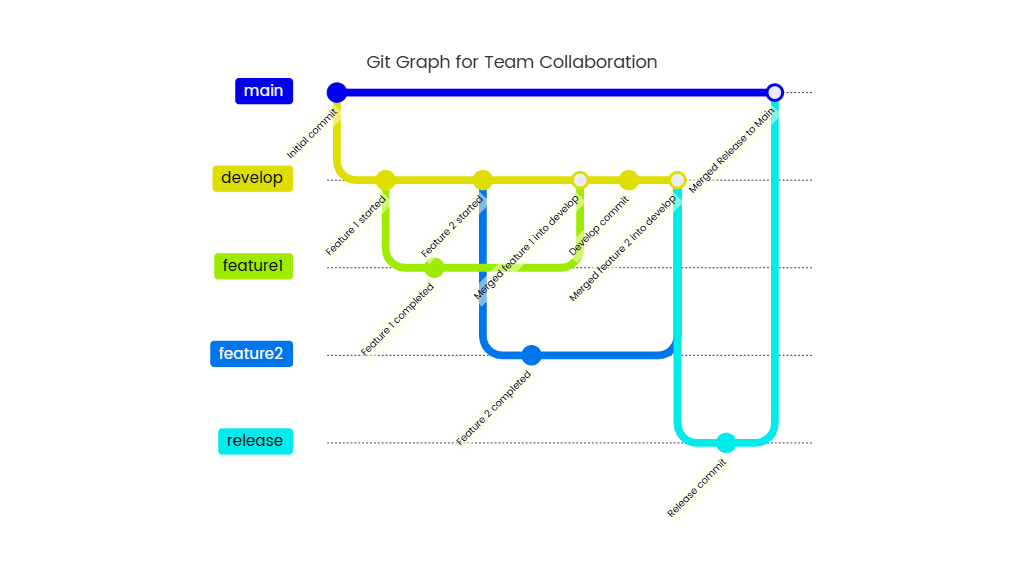
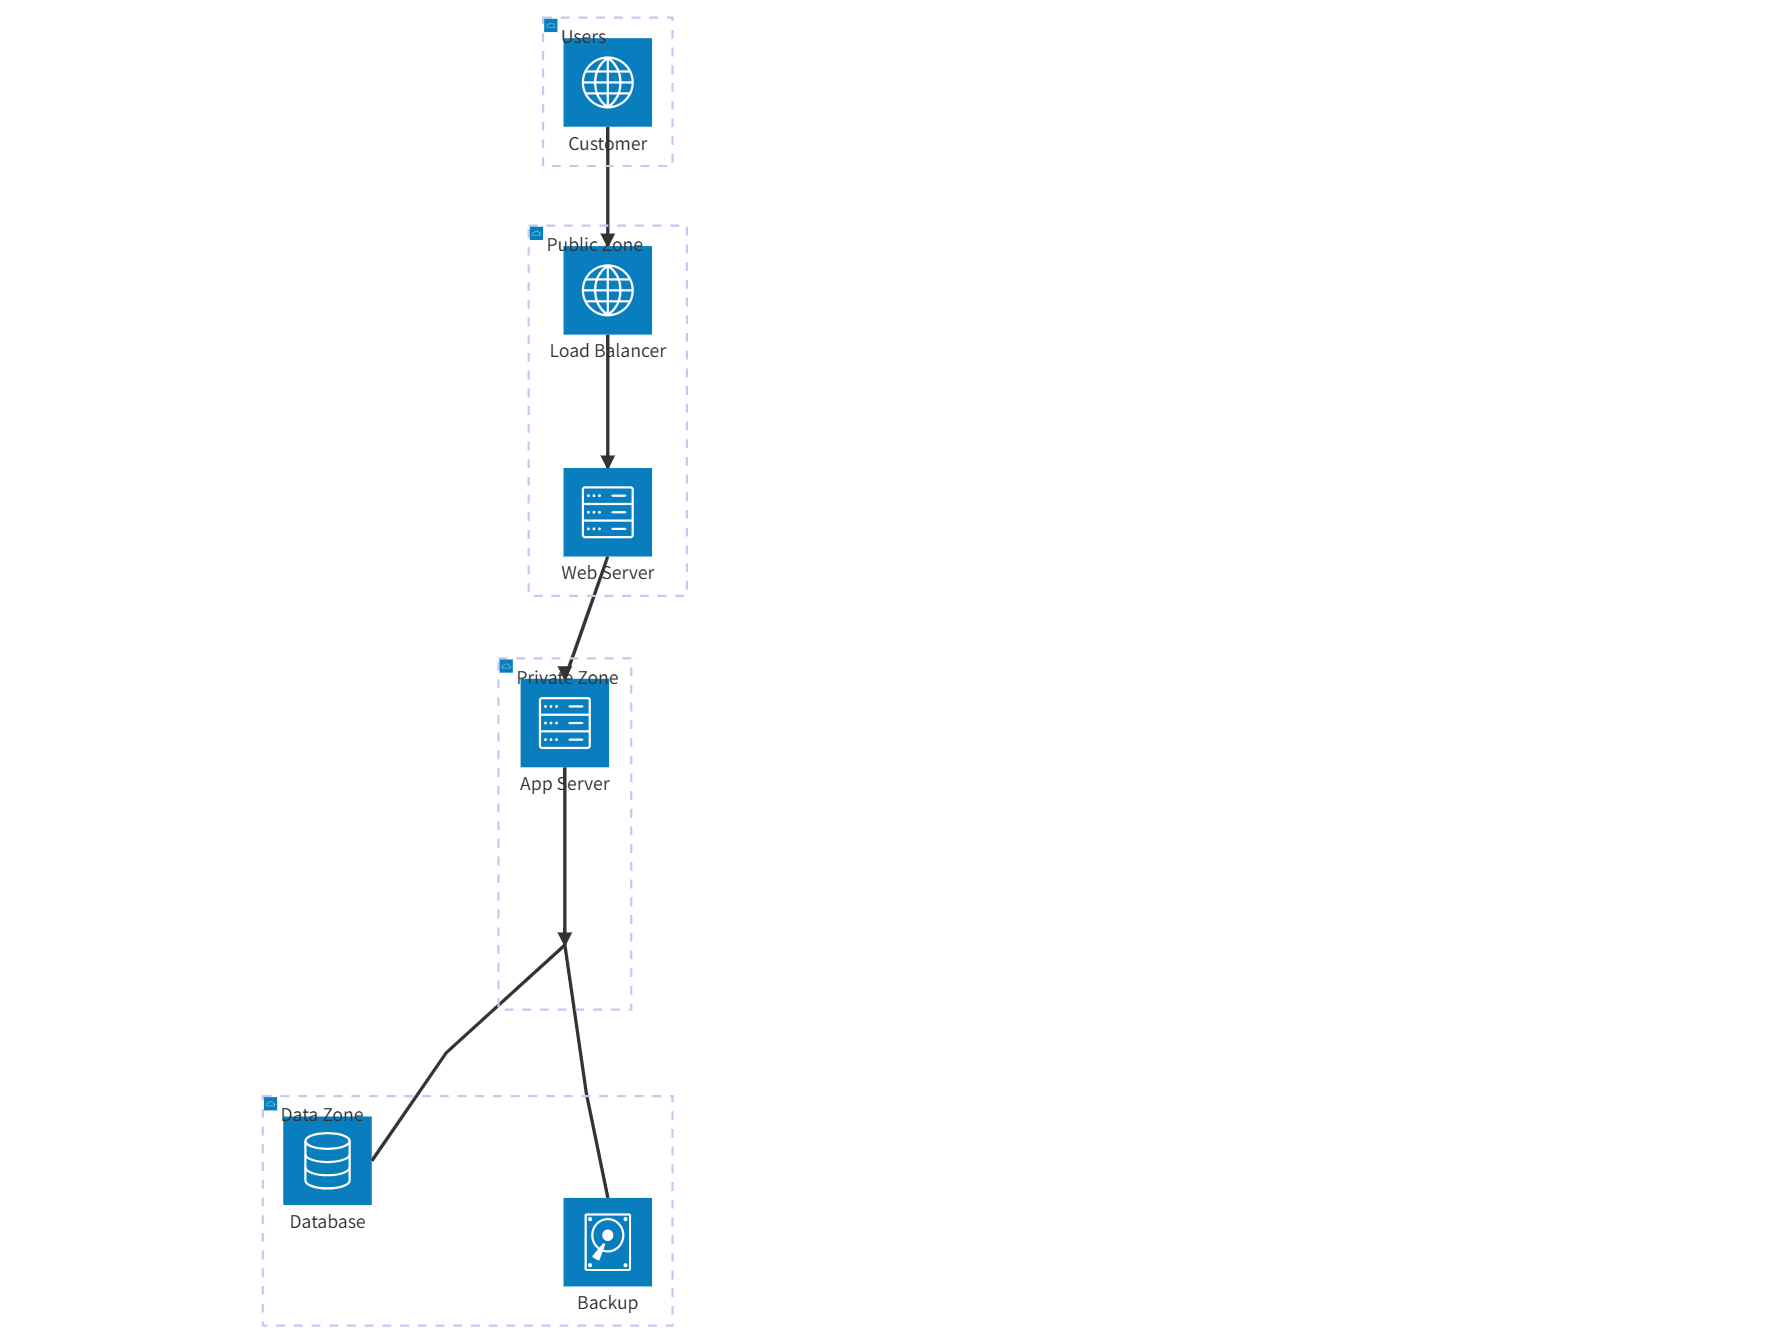
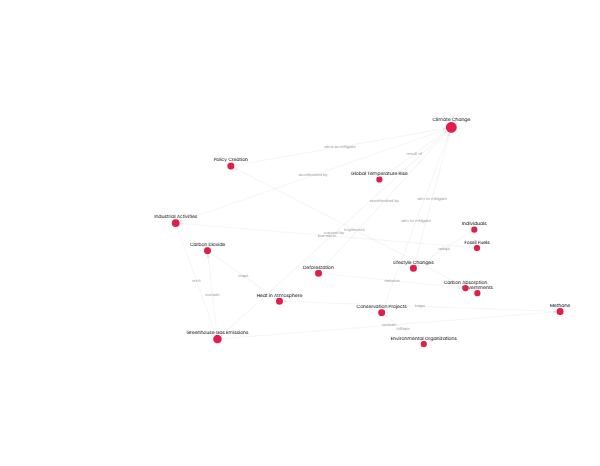
A Git graph for historical analysis is a powerful tool for visualizing how a project has evolved over time, tracking changes, milestones, and collaboration patterns. It maps commits as nodes and branches as lines, showing forks, merges, and divergences in development. By analyzing this graph, teams can identify critical milestones (e.g., releases, major features), understand why decisions were made, and trace the origin of bugs or features. It reveals patterns like long-running branches, contributor activity, and integration strategies, helping stakeholders grasp the project’s historical context and inform future development.