Added on:
May 07, 2025
User Prompt
Gantt Chart for Software Development Project: Tracking Milestones and Task Dependencies
Description
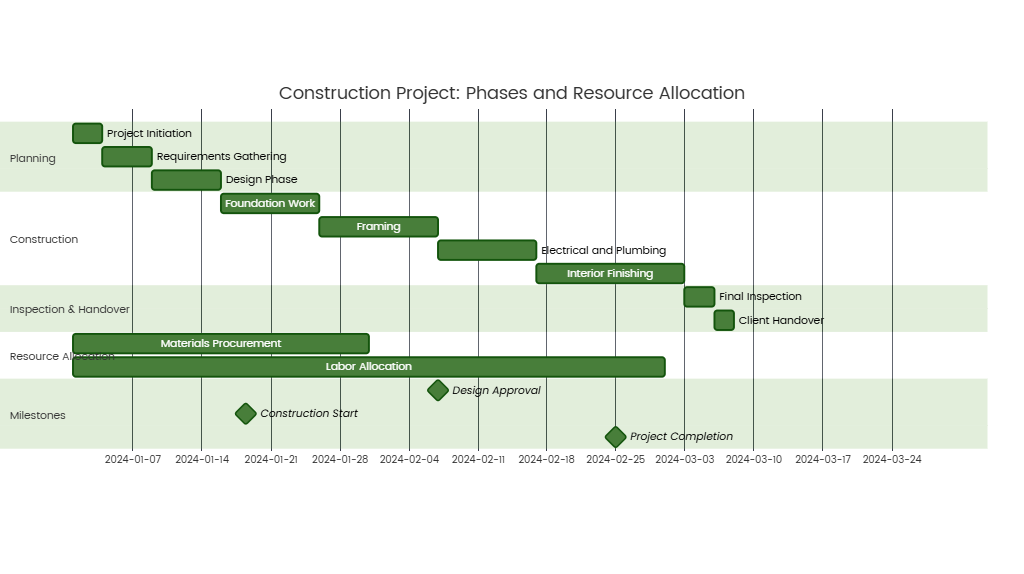
A Gantt chart is a visual project management tool that maps the timeline, milestones, and dependencies of a software development project. It provides a comprehensive overview of tasks, their durations, and interdependencies, enabling teams to track progress, allocate resources, and identify potential bottlenecks. Below is a detailed description of its components and applications in software development.
Key Components of a Software Development Gantt Chart
- Timeline
- Horizontal Axis: Represents the project’s duration (e.g., weeks, months).
- Vertical Axis: Lists tasks, phases, and milestones.
- Tasks & Phases
- Examples:
- Planning: Requirements gathering, feasibility analysis, project charter.
- Design: Architecture design, UI/UX prototyping, database modeling.
- Development: Frontend/backend coding, API integration, unit testing.
- Testing: QA testing, user acceptance testing (UAT), bug fixing.
- Deployment: Staging, production release, post-deployment support.
- Examples:
- Milestones
- Critical checkpoints marked as diamonds or icons (e.g., “Project Kickoff,” “MVP Release,” “Final Deployment”).
- Purpose: Signify completion of major phases or deliverables.
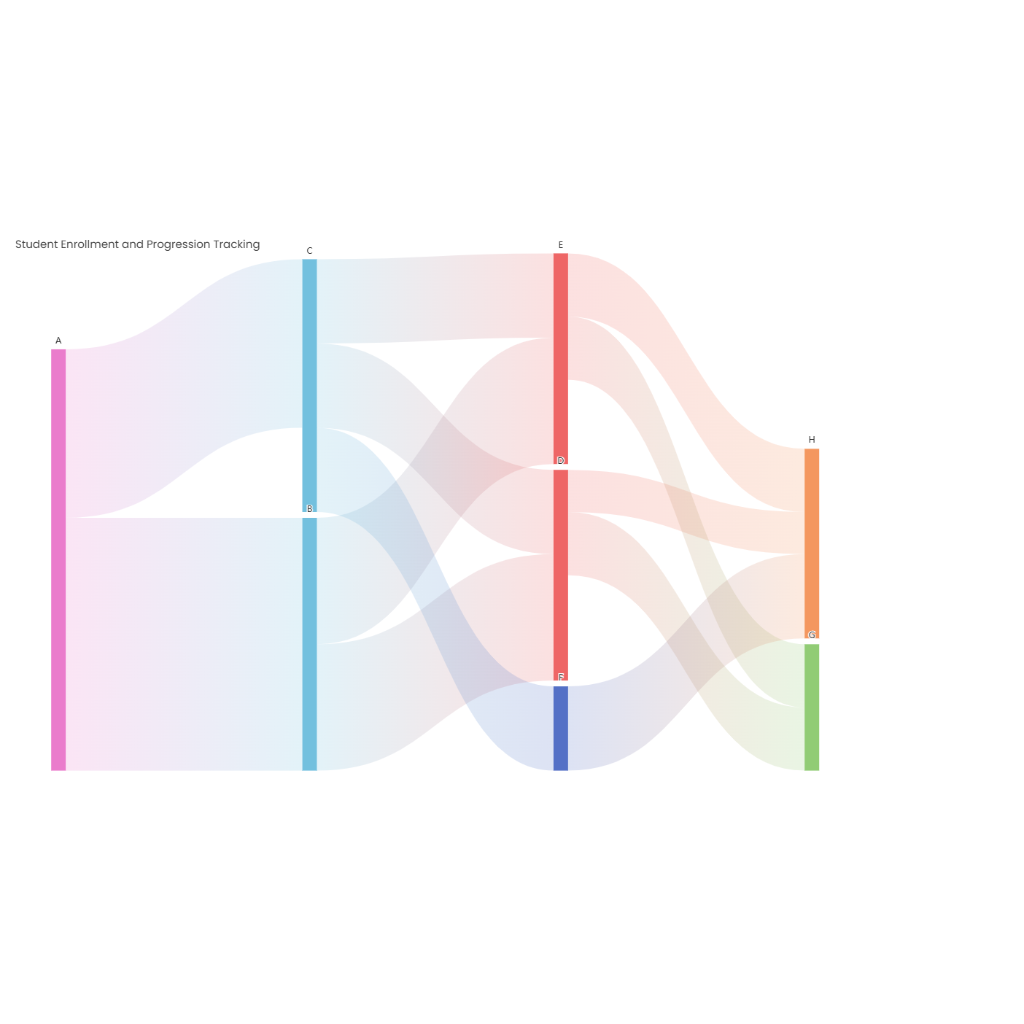
- Dependencies
- Arrows connecting tasks to indicate sequential relationships (e.g., “UI Design” must finish before “Frontend Development”).
- Types:
- Finish-to-Start (FS): Task B starts after Task A completes.
- Start-to-Start (SS): Task B starts when Task A starts.
- Finish-to-Finish (FF): Task B finishes when Task A finishes.
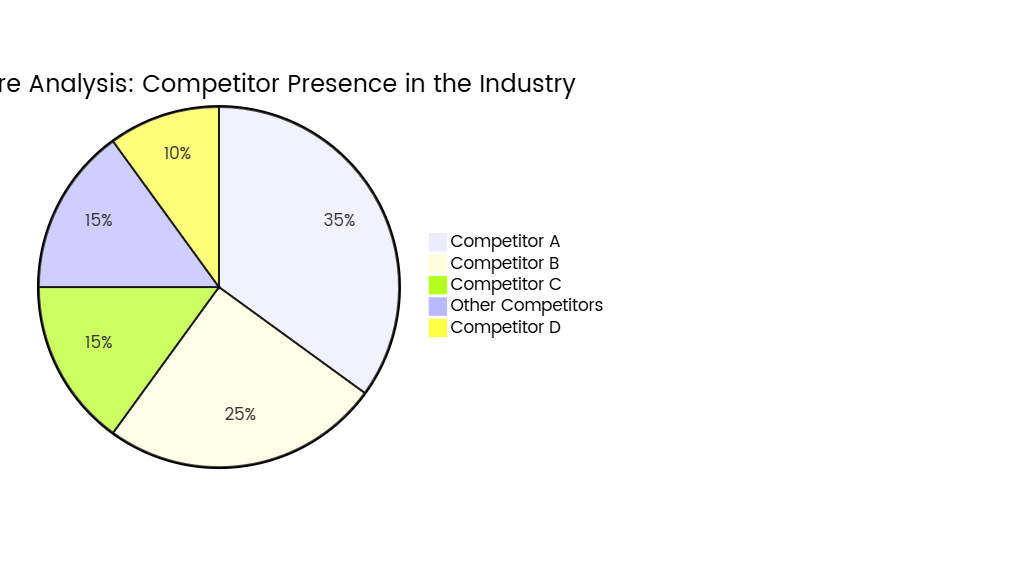
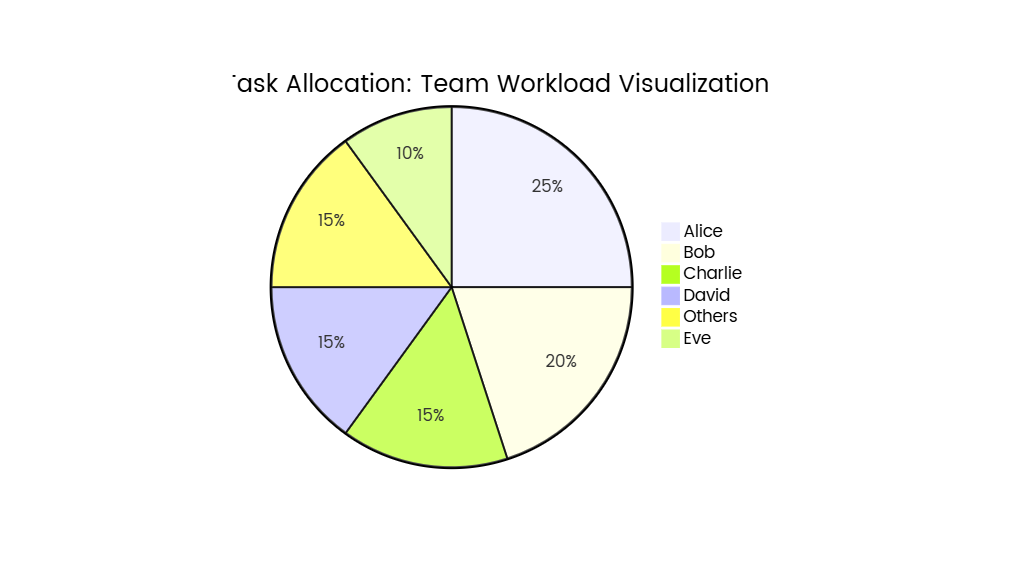
- Resource Allocation
- Tasks are color-coded or labeled by responsible teams/individuals (e.g., “Dev Team,” “QA Lead”).
- Example: A bar labeled “Backend API” might be assigned to “John Smith.”
- Progress Tracking
- Shaded or filled sections within task bars show completed work (e.g., a 50% filled bar indicates half the task is done).
Example Workflow in a Software Gantt Chart
- Requirement Gathering (Week 1–2)
- Dependencies: None (starting point).
- Milestone: “Requirements Document Approved.”
- UI/UX Design (Week 3–4)
- Dependencies: Requires completed requirements.
- Output: Design prototypes handed off to developers.
- Backend Development (Week 5–8)
- Dependencies: Starts after UI/UX sign-off (FS relationship).
- Parallel Tasks: Database setup, API development.
- Frontend Development (Week 7–10)
- Dependencies: Depends on backend APIs being available (SS relationship with backend).
- Risk: Delays in backend may block frontend progress.
- Integration Testing (Week 11–12)
- Dependencies: Requires both frontend and backend completion (FF relationship).
- Milestone: “Core Functionality Tested.”
- Deployment (Week 13)
- Dependencies: Successful testing and stakeholder approval.
- Milestone: “Production Launch.”
Benefits of Using a Gantt Chart in Software Development
- Visual Clarity
- Teams can quickly grasp the project timeline and dependencies.
- Example: A developer can see how their task (e.g., “Payment Gateway Integration”) aligns with the overall schedule.
- Dependency Management
- Prevents bottlenecks by highlighting critical paths (e.g., if “Database Migration” is delayed, subsequent testing phases are at risk).
- Resource Optimization
- Helps managers allocate team members to tasks based on availability and expertise.
- Example: Avoid overloading a single developer with concurrent high-priority tasks.
- Stakeholder Communication
- Provides a shared reference for clients, executives, and team members to track progress.
- Example: A CTO can review the chart to confirm that the “AI Feature” is on track for the beta release.
- Risk Mitigation
- Identifies potential delays early (e.g., a task taking longer than planned) so teams can adjust timelines or resources.
Tools for Creating Gantt Charts
- Project Management Software: Jira, Trello, Asana, Microsoft Project, Smartsheet.
- Spreadsheets: Excel, Google Sheets (using custom formulas or add-ons).
- Dedicated Gantt Tools: GanttPRO, TeamGantt, Wrike.
Best Practices
- Keep it Dynamic
- Update the chart regularly (e.g., weekly) to reflect actual progress and changes.
- Avoid Overcomplication
- Focus on high-level tasks and dependencies; granular details can be managed in task boards.
- Link to Deliverables
- Attach documents (e.g., design specs, test plans) to relevant tasks for easy access.
- Communicate Changes
- Notify the team when dependencies or timelines shift to prevent misalignment.