How to Use AI Graph Makers to Draw Complex Function Curves: A Step-by-Step Guide
Impact-Site-Verification: a73c7a2c-c49d-4293-9c57-fa7e6fc7b566
AI graph makers like Edraw.AI, AIGraphMaker.net, GraphMaker.ai, and Piktochart AI simplify the process of plotting complex functions, including piecewise and multivariable cases.
These tools automate data analysis, generate accurate visuals, and offer customization for educational or professional use.
Below, we demonstrate how to sketch two challenging examples using AI tools:
- Piecewise Function with linear and quadratic components.
- Domain of a Multivariable Function involving logarithmic constraints.
Example 1: Sketching a Piecewise Function
and here is the prompt we can input:
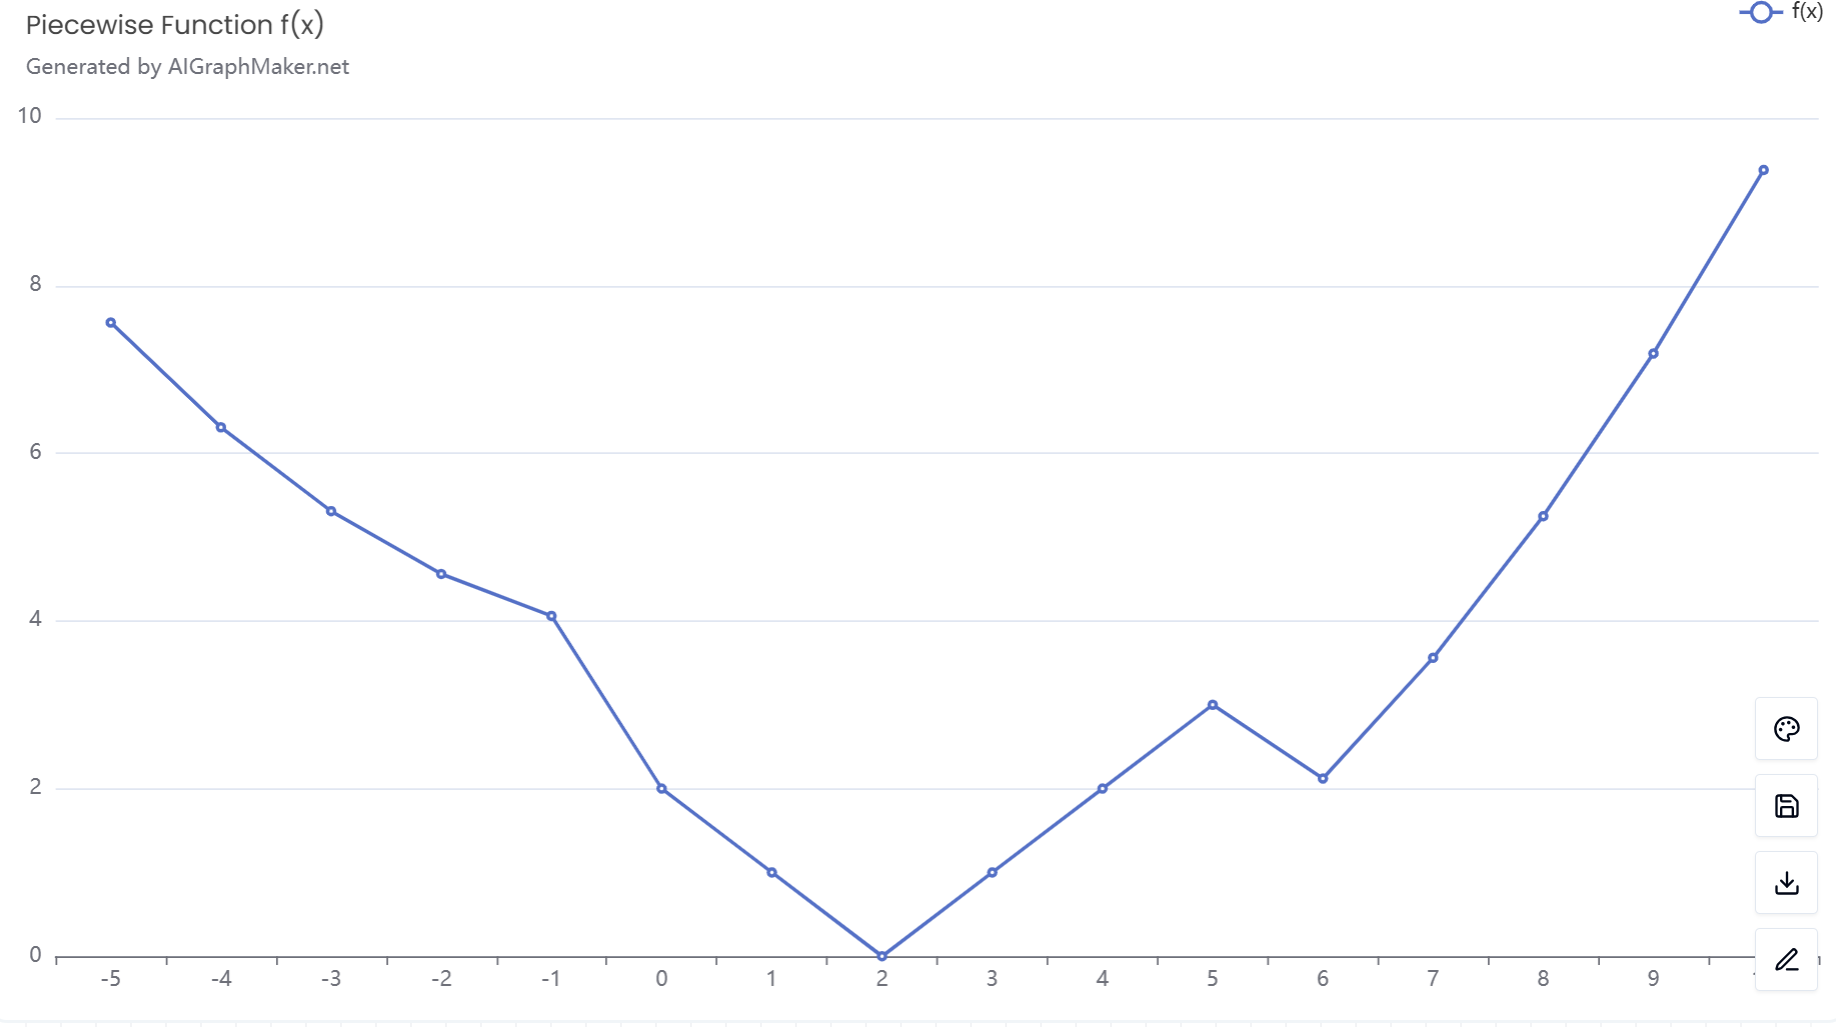
Sketch the graph, draw three pieces:
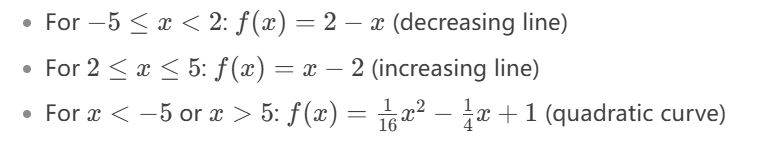
(1) For -5 ≤ x < 2, f(x) = 2 - x (straight line, decreasing).
(2) For 2 ≤ x ≤ 5, f(x) = x - 2 (straight line, increasing).
(3) For x < -5 or x > 5, f(x) = (1/16) * x² - (1/4) * x + 1 (quadratic curve).Customize the Graph:
- Label Key Points: Mark intercepts (0,2) and (2,0), critical point at x = 2, and boundaries at x = -5 and x = 5.
- Annotate Behavior: Add text labels like "Decreasing on [-5, 2)" or "Increasing on [2, 5]." Label points of non-differentiability at x = -5, 2, and 5 (sharp turns).
and then aigraphmaker will generate the following chart:
Here is the online iframe to view the chart:
Example 2: Visualizing the Domain of a Multivariable Function
Function: f(x, y) = log₂(x + y)
Domain Constraints:
x + y > 0 (above line y = -x)
x > 0 (right half-plane)
Define Constraints:
- Input inequalities: "Shade the region where x > 0 and y > -x. Exclude boundaries x = 0 and y = -x."
Plot Boundaries:
- Draw y = -x as a dashed line (excluded from the domain).
Highlight x > 0 with a vertical line at x = 0.
Input Prompt
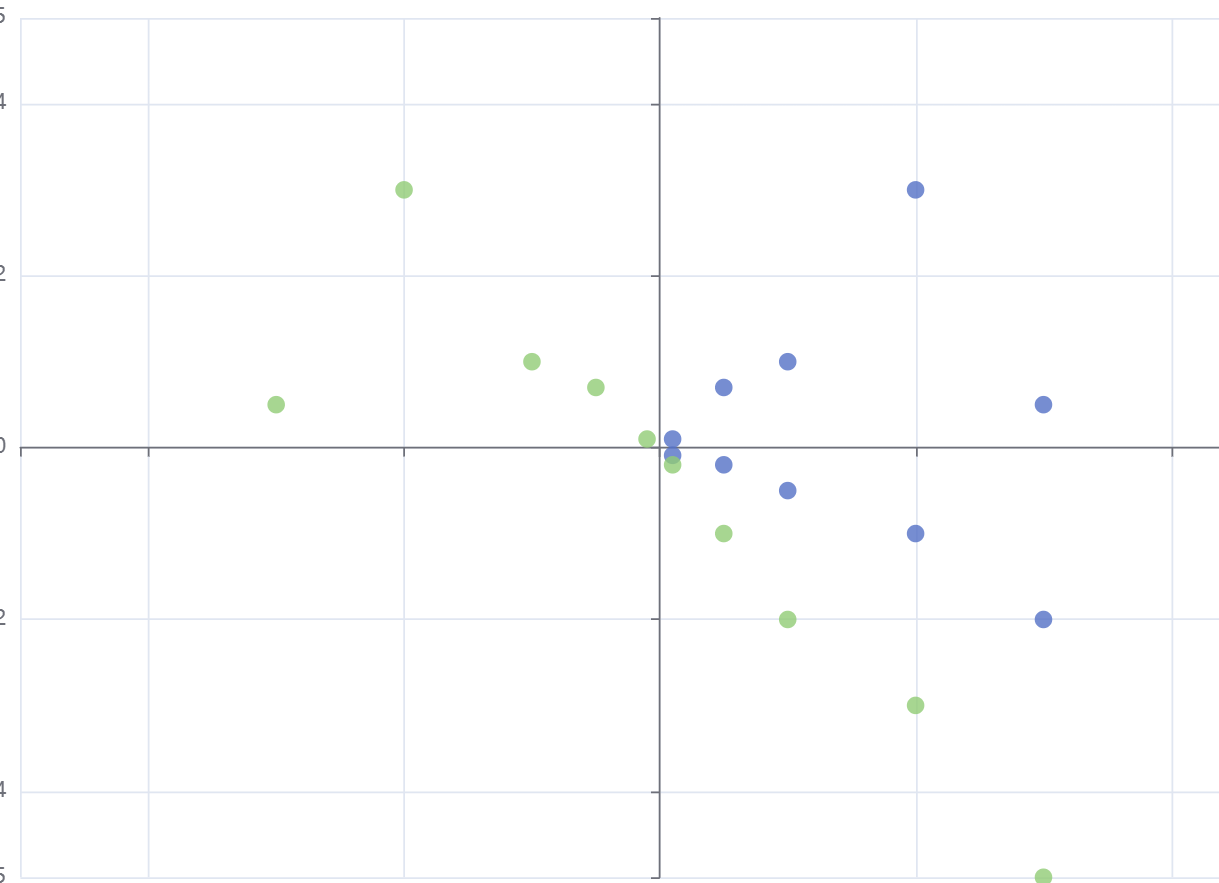
Sketching the domain of f(x, y) = frac{log_2 (x + y)}{sqrt{x}}
The function is defined where: x + y > 0 (i.e., the region above the line y = -x).
x > 0 (i.e., only the right half-plane is valid).
Final domain: The shaded region where both conditions hold, this is the region in the first quadrant and the right half of the second quadrant above the line y = -x.
we will get the following chart
the online chart is here:
Tips for Effective AI Graphing:
Specify Intervals Clearly: For piecewise functions, define x-ranges explicitly to avoid AI misalignment.
Use Mathematical Notation: Tools like aigraphmaker.net recognize LaTeX-style equations (e.g., ).
Verify Continuity: Check if segments connect smoothly at boundary points (e.g., x = -5 in Example 1).
By combining AI’s computational power with human oversight, you can transform abstract equations into insightful visuals effortlessly. Whether for calculus homework or engineering projects, these tools democratize advanced graphing, no coding required,
let's just make graph!