Description
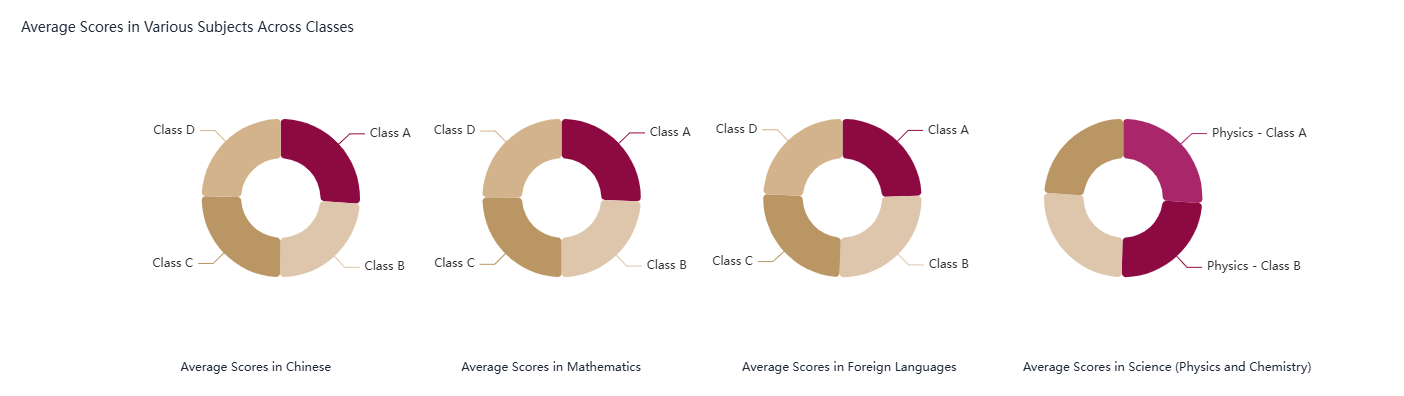
Structure
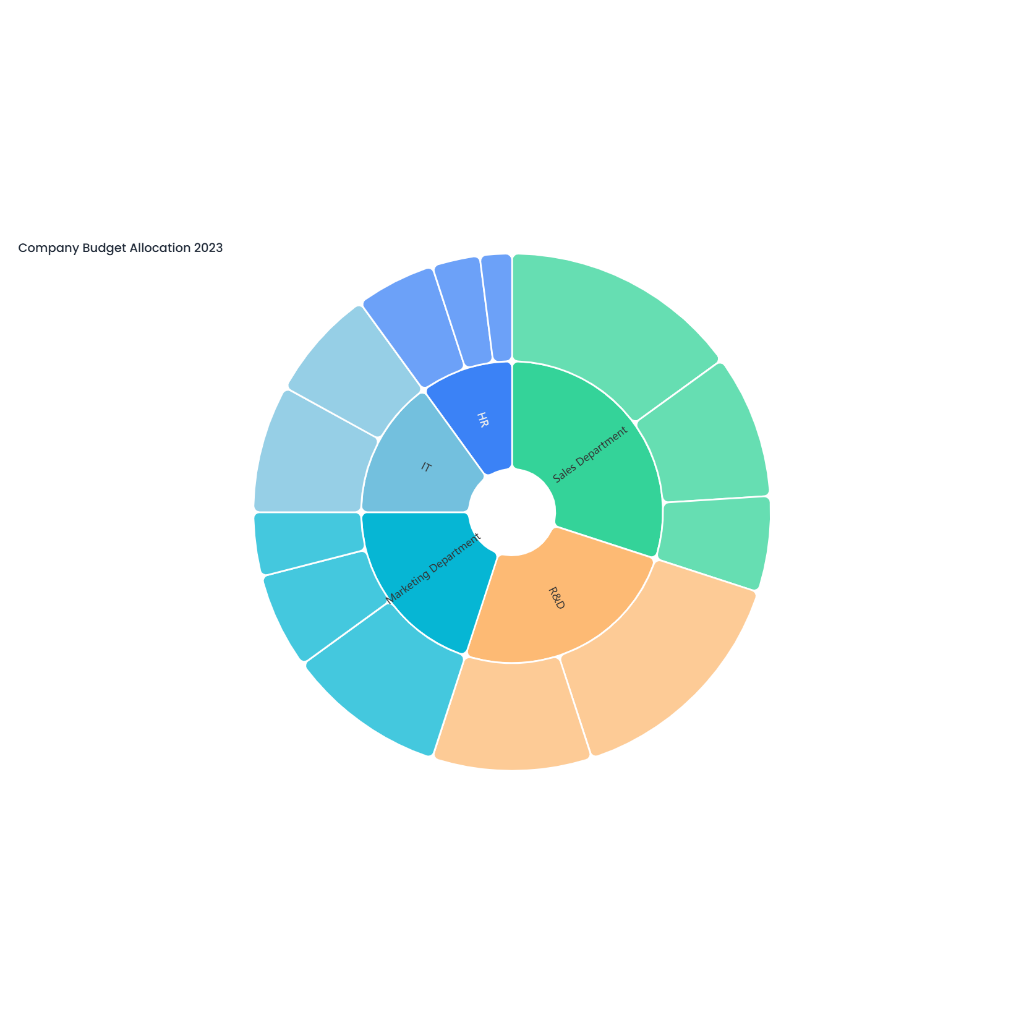
The doughnut chart for company budget allocation provides a clear visual representation of how a company distributes its financial resources across different departments or expense categories. The chart is designed as a doughnut-shaped ring divided into several segments. Each segment corresponds to a specific department or expenditure category, such as research and development (R&D), marketing, operations, human resources, finance, and information technology. The size of each segment is proportional to the percentage of the total budget allocated to that particular area. For example, if R&D receives 30% of the company's budget, its segment will occupy 30% of the doughnut ring. Each segment is color-coded and labeled with the department name and its corresponding budget percentage to ensure clarity.
Interpretation and Applications
This chart offers valuable insights for company executives, financial analysts, and stakeholders. By examining the segments, they can quickly understand which departments receive the largest shares of the budget and which have more limited resources. A larger segment for a department like R&D may indicate the company's focus on innovation and product development, while a smaller segment for marketing might suggest opportunities to increase market visibility and customer acquisition.
The doughnut chart also serves as a useful tool for budget planning and optimization. It allows management to compare the current budget allocation with previous periods or with industry benchmarks. This comparison can help identify areas where budget reallocation may be necessary to better align with the company's strategic goals. For instance, if the company aims to expand its market presence, it might consider increasing the budget allocation to the marketing segment.
Furthermore, the chart simplifies communication of budget information to stakeholders. It can be included in financial reports, board meetings, or investor presentations to provide a concise and visually appealing overview of how the company's funds are being utilized. This transparency helps build trust and ensures that all parties have a clear understanding of the company's financial priorities.
In summary, the doughnut chart for company budget allocation is an effective visual tool that provides a comprehensive overview of how financial resources are distributed across different departments. It aids in decision-making, strategic planning, and communication, helping companies optimize their budget allocation to achieve their business objectives.