Make a chart that shows a magic of creating with machines of ai Creating charts with AI tools can be a magical experience, as they simplify the process of data visualization. Platforms like MagicChart and AI Graph Maker allow users to generate interactive and visually appealing charts quickly, transforming complex data into understandable visuals.
**Benefits of Using AI for Chart Creation**
- **Speed and Efficiency**: AI tools can generate charts in seconds, significantly reducing the time spent on manual chart creation.
- **User -Friendly**: Many AI platforms offer intuitive interfaces that allow users of all skill levels to create charts without extensive training.
- **Customization Options**: Users can easily customize charts to fit their branding or specific data presentation needs.
**Popular AI Charting Tools**
- **MagicChart**:
- Allows users to create charts by simply entering a query.
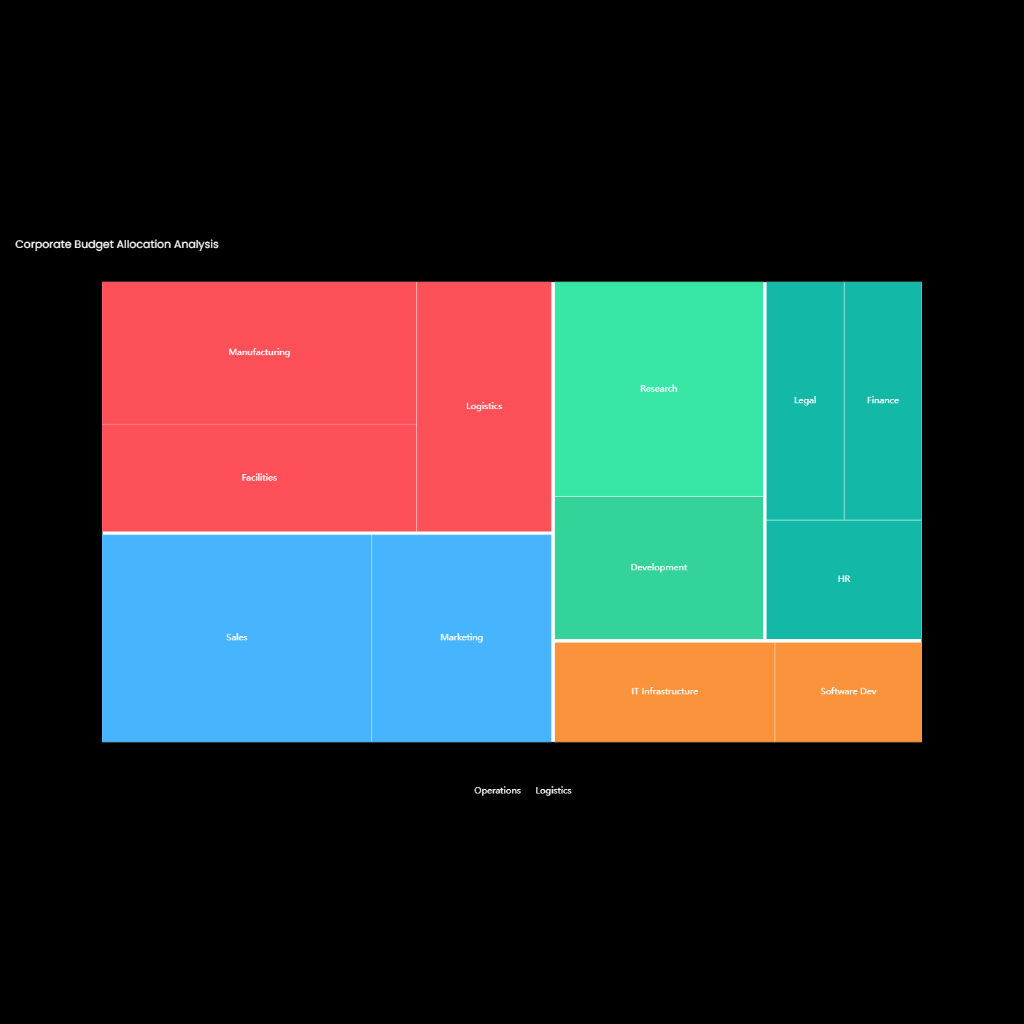
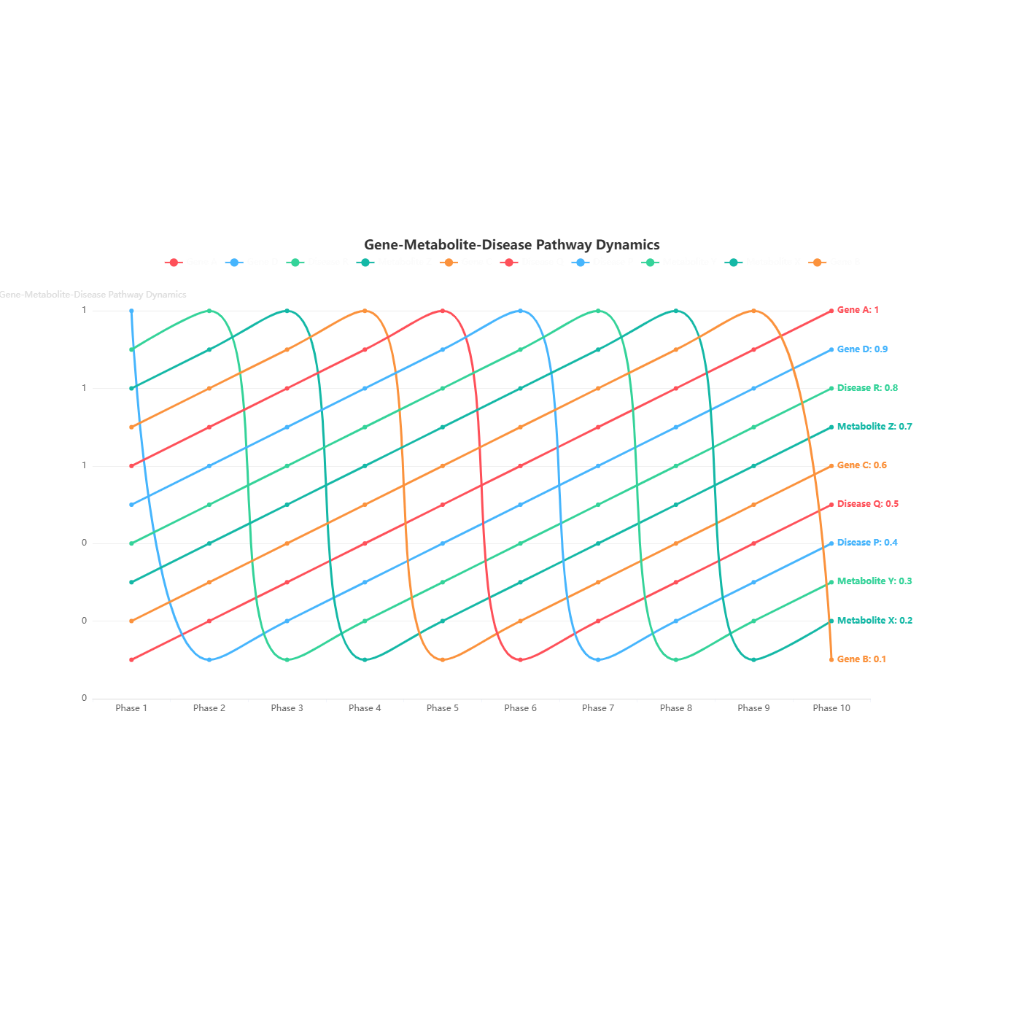
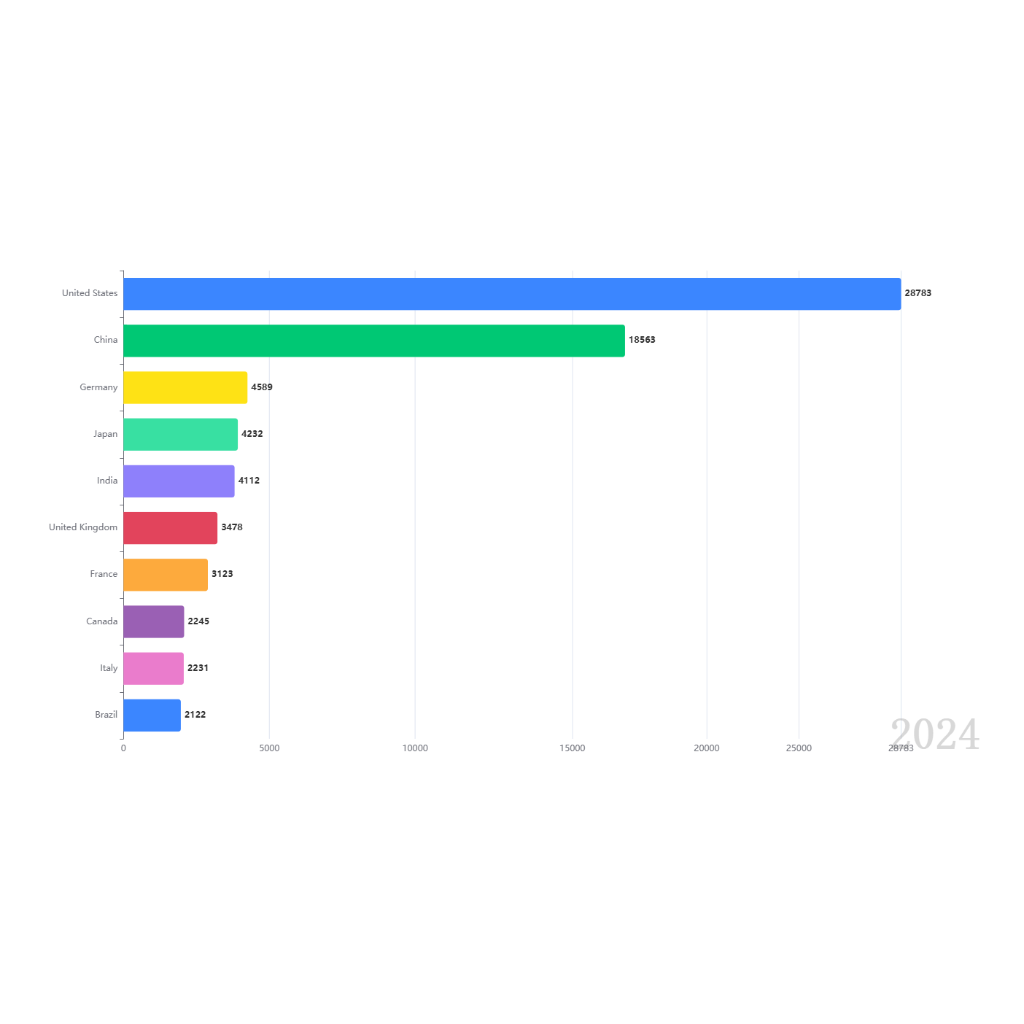
- Offers a variety of chart types, including bar, line, and pie charts.
- **AI Graph Maker**:
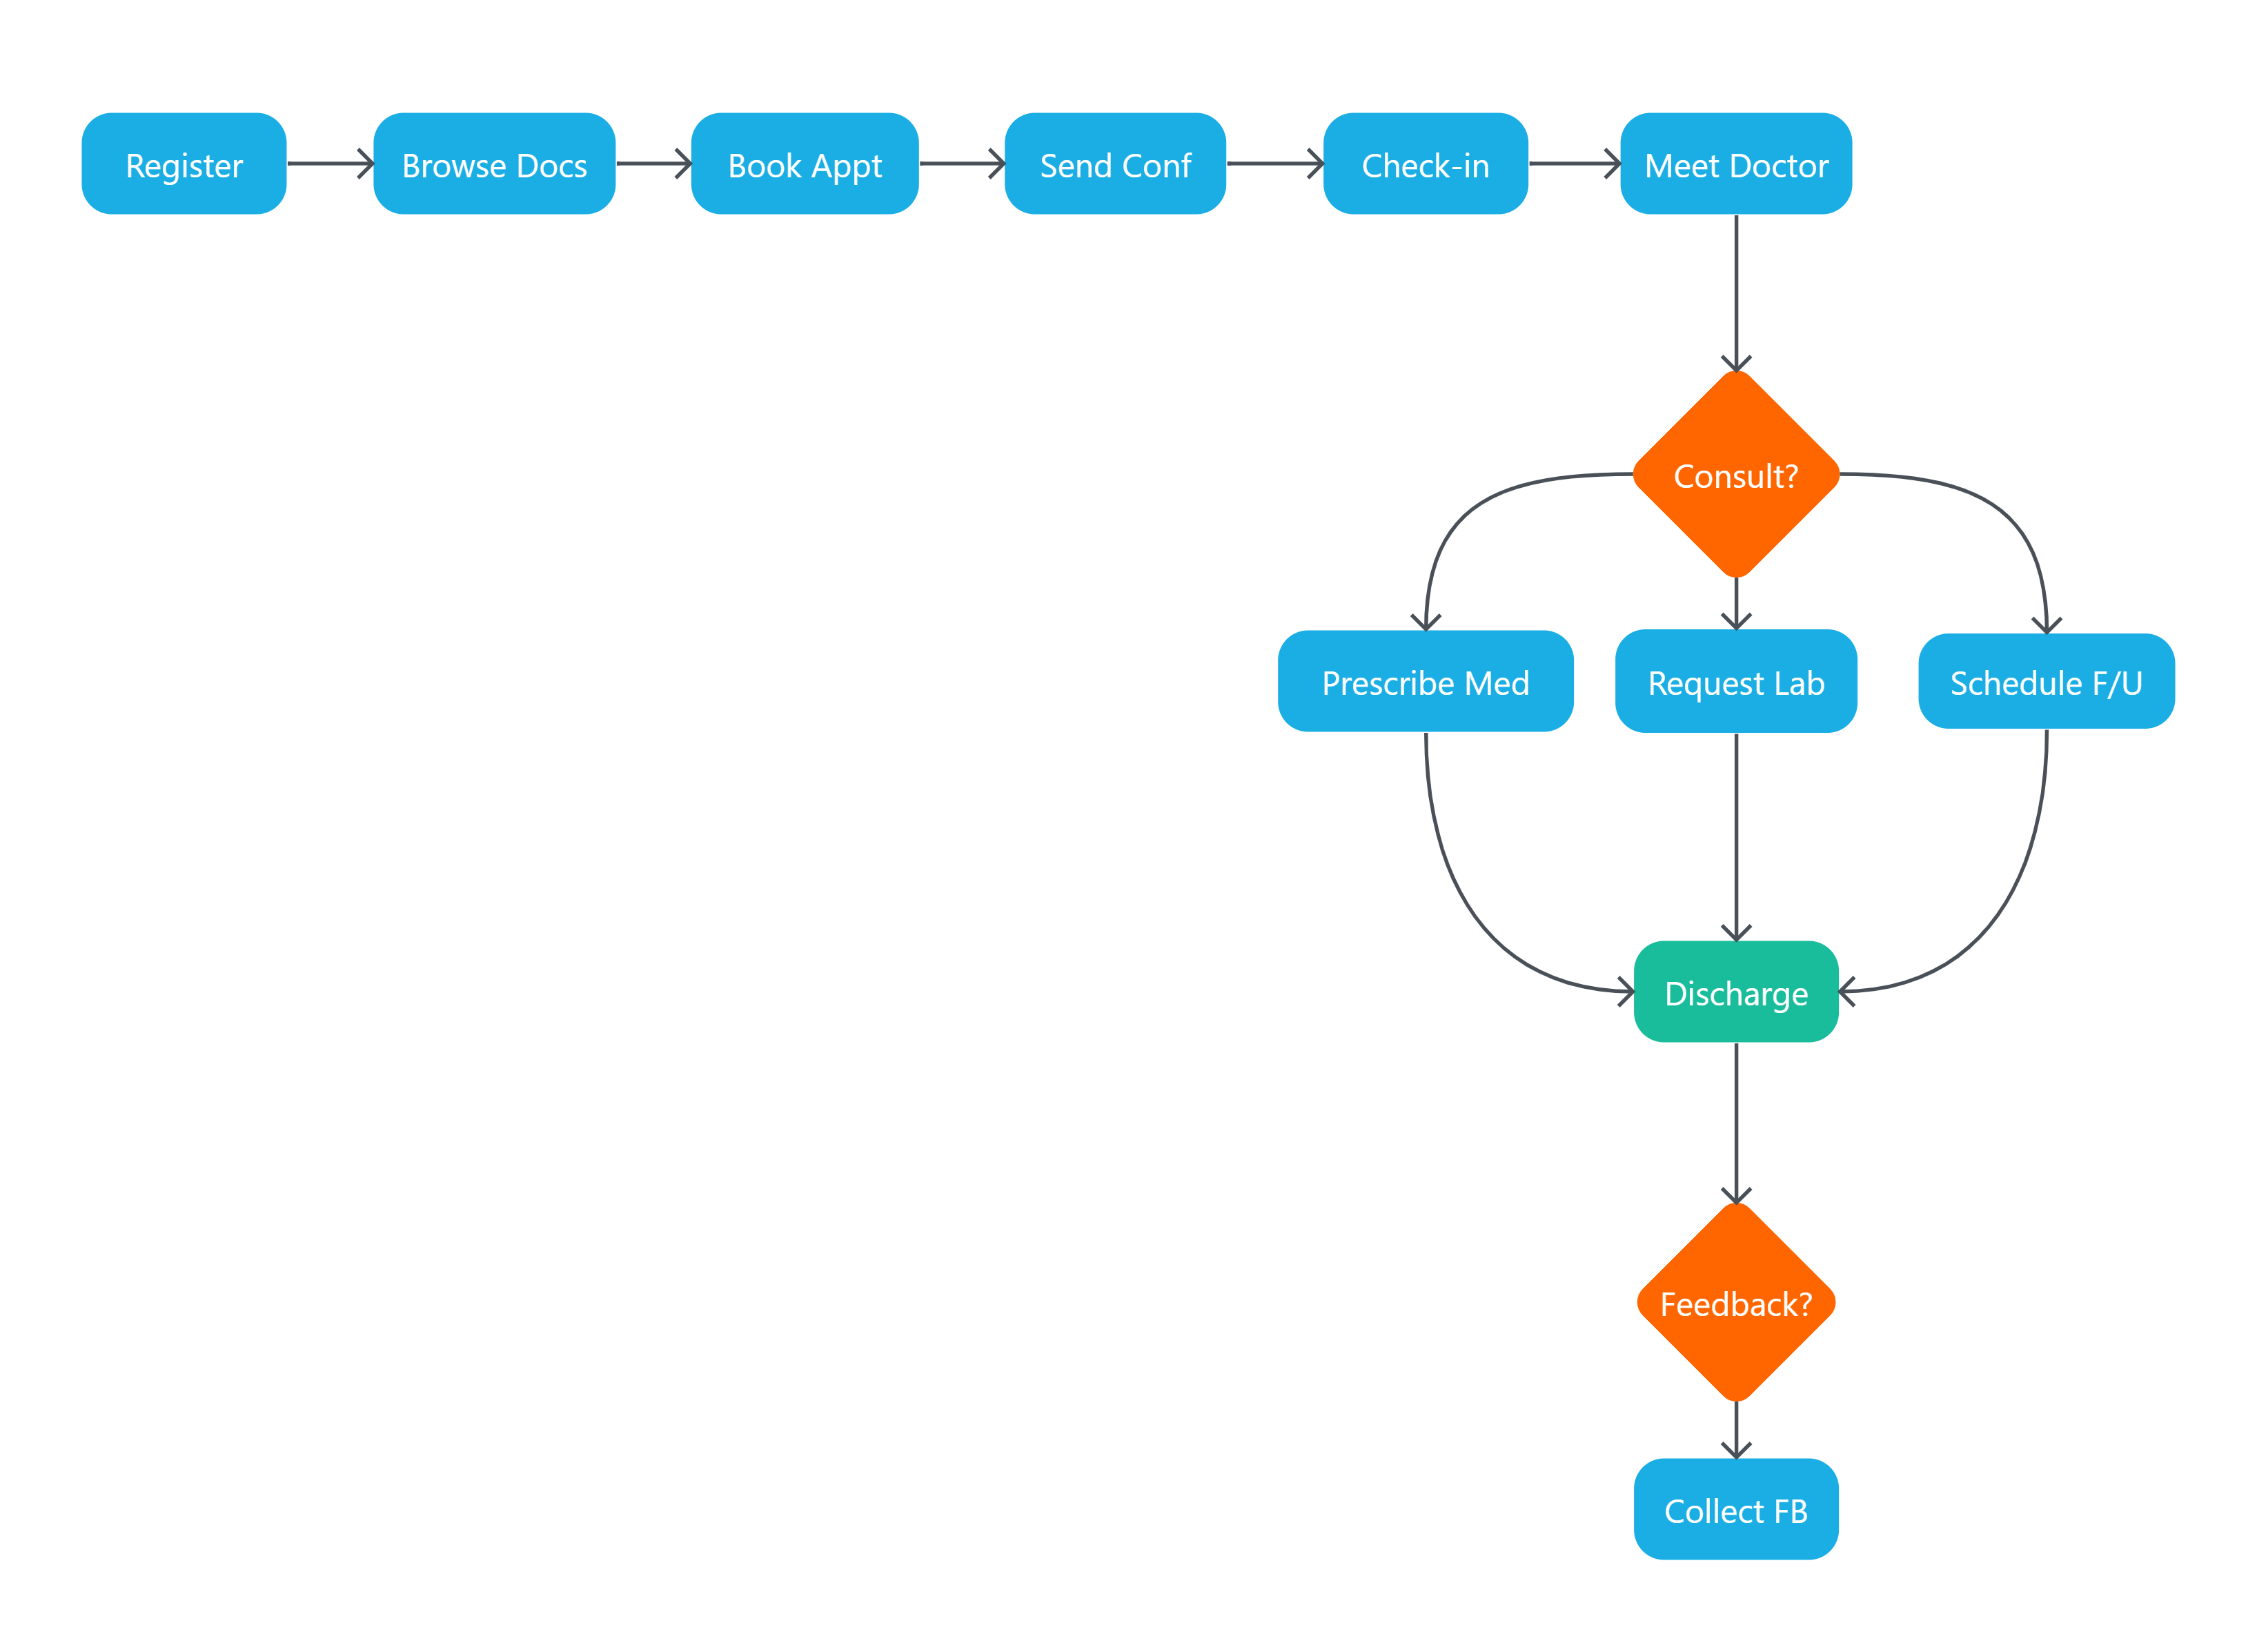
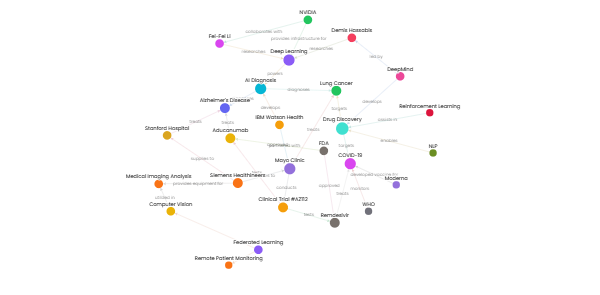
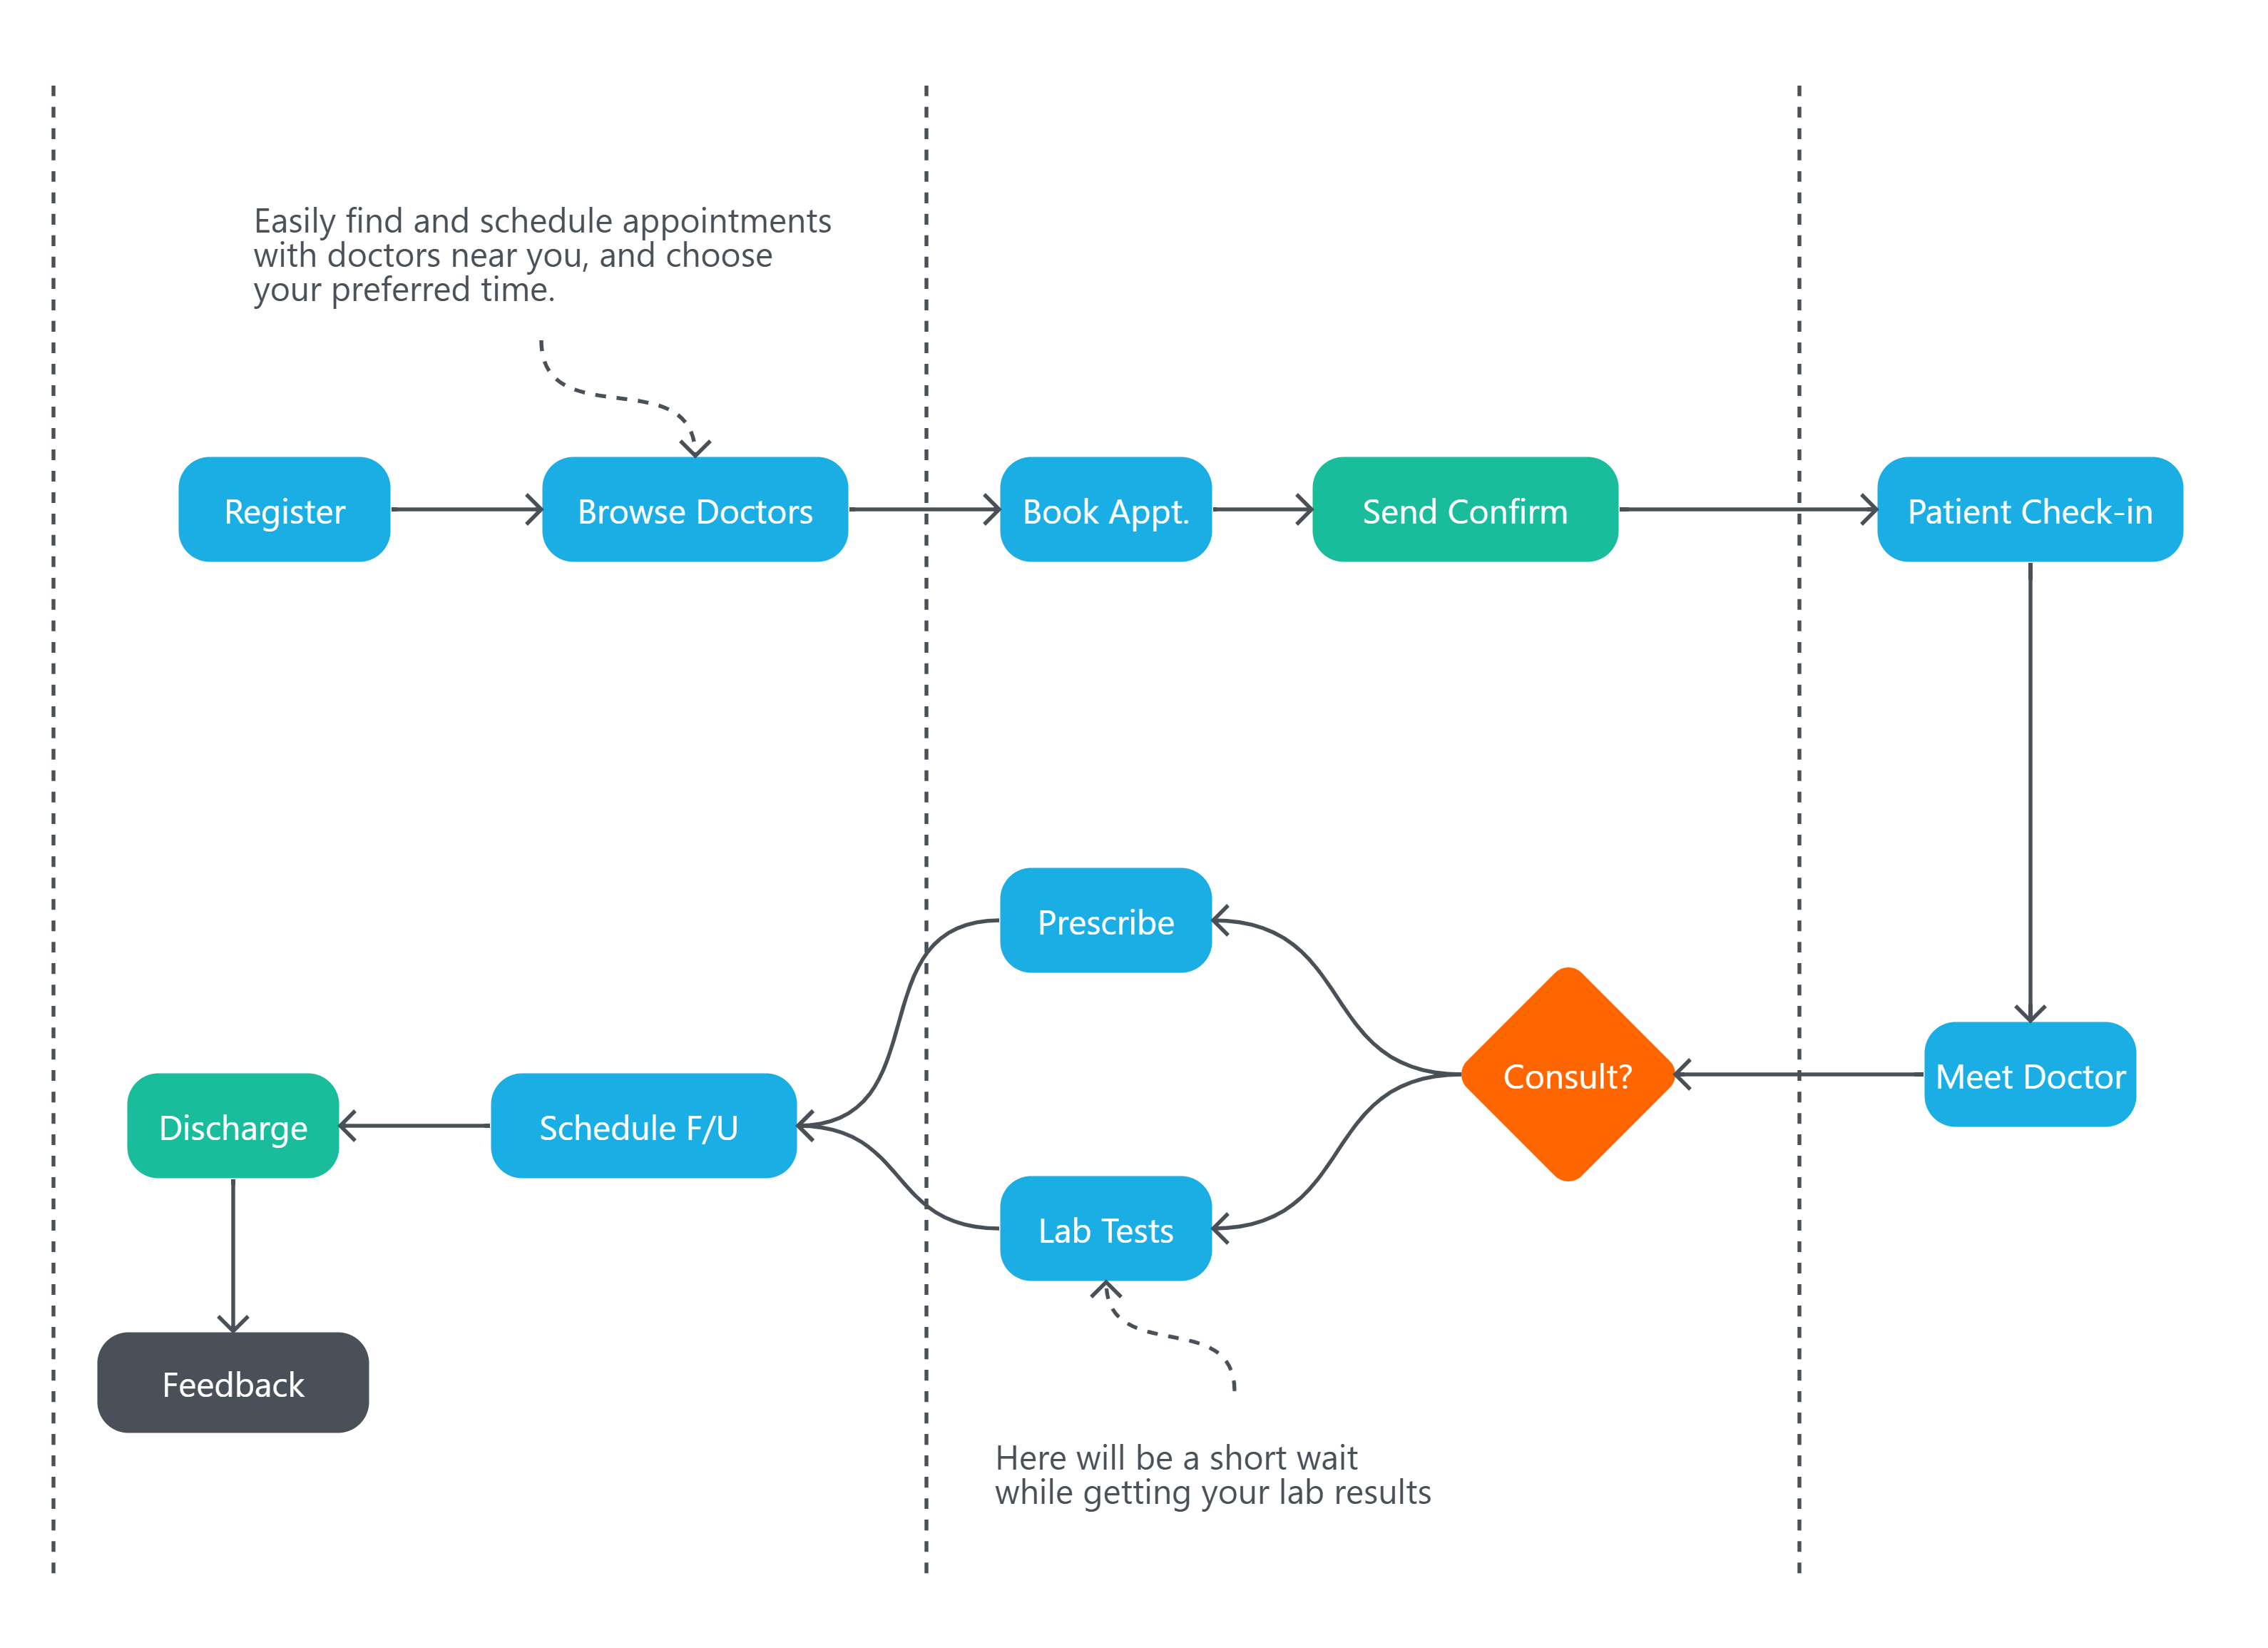
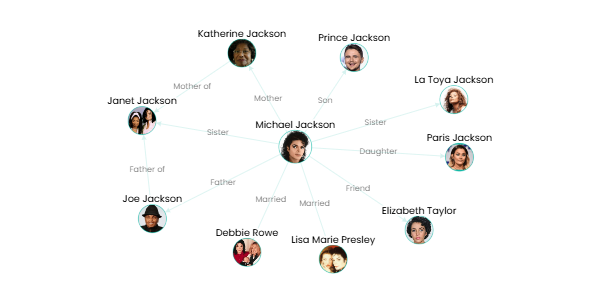
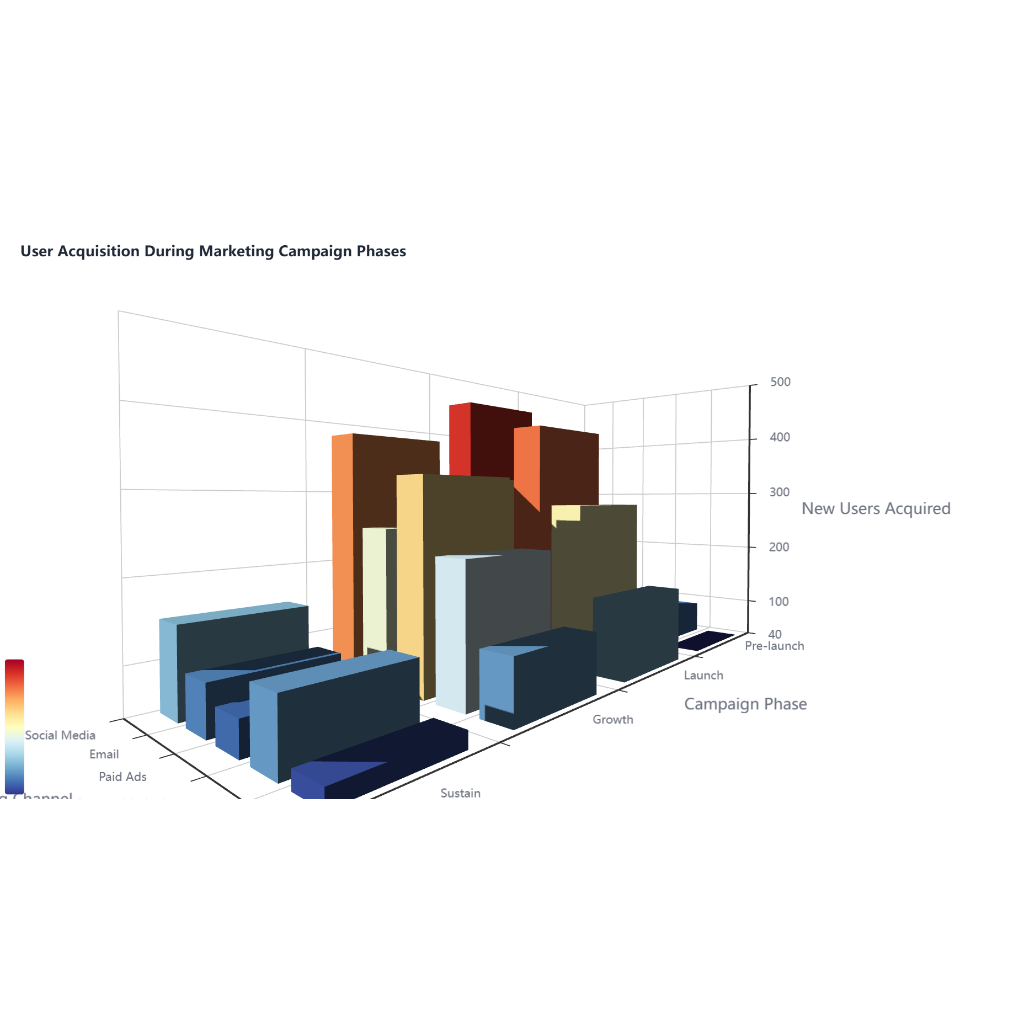
- Enables the creation of custom charts like flowcharts and scatter plots.
- Provides interactive features for enhanced data engagement.
**How AI Enhances Data Visualization**
- **Intelligent Recommendations**: AI analyzes data patterns and suggests the most suitable chart types.
- **Natural Language Processing**: Users can describe the chart they want in plain language, and the AI generates it accordingly.
- **Real-Time Updates**: Many AI tools allow for dynamic data linking, ensuring charts reflect the latest information.
**Conclusion**
Utilizing AI for chart creation not only streamlines the process but also enhances the quality and effectiveness of data visualization. By leveraging these tools, users can focus more on data analysis and storytelling rather than the technicalities of chart formatting.