Free Excel Chart Generator
Free Excel Chart Generator Features

Excel-like Table Editor

13+ ECharts Types Supported

Smart Features: markPoint, markLine, markArea

Full JSON Config Editor

Design Controls: Legend, Color, Axis, Tooltip

Export & Embed Options
How to Create a Chart with AI Excel Chart Generator

01
Data Input & Copy
Open your Excel file (or Google Sheets), select the table you want to use, and press Ctrl + C (or Cmd + C on Mac) to copy it. Go to our chart tool and simply paste (Ctrl + V) your data into the Excel-like editor.
02
Choose a Chart Type
Pick from 13+ chart types like bar, line, pie, radar, scatter, etc. The chart will update automatically based on your data.
03
Customize Your Chart
You can change colors, add markPoint/markLine, adjust legend and axis, fine-tune tooltips and labels. Use the visual settings panel - or open the JSON editor for full control with ECharts options.
04
Preview and Export
See real-time changes as you tweak data or chart settings. Make adjustments until the chart looks perfect. And you can download as PNG or JSON.
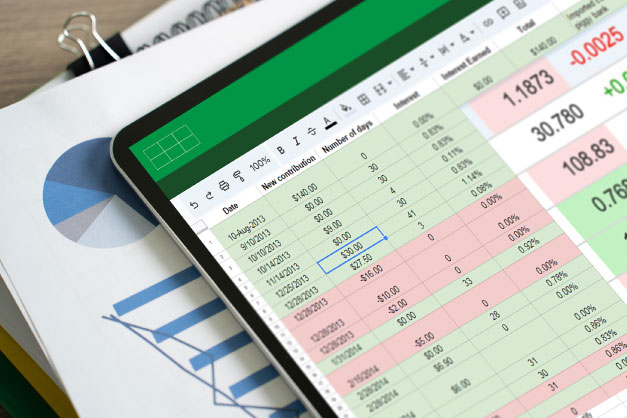
Paste & Edit Excel Data
Our Excel Chart Maker lets you instantly turn raw Excel data into charts — just copy and paste directly from your spreadsheet. You’ll get a familiar Excel-like interface where you can edit cells, use drag-to-fill, and navigate using keyboard shortcuts. No messy formatting, no complex import steps - just pure productivity.
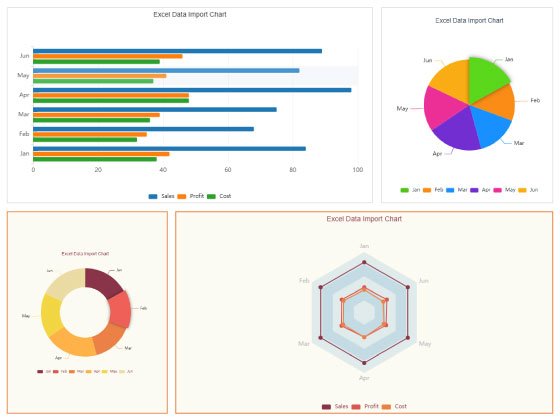
Supports 13+ Interactive Chart Types
Visualize your data your way. The Excel Chart Maker supports a wide variety of ECharts-based charts including bar charts, line charts, pie charts, radar charts, scatter plots, funnel charts, line-bar combo chart, and more. Whether you’re presenting sales data, performance metrics, or survey results, you’ll find the perfect chart type here.

Full JSON Editor for Power Users
For advanced users and developers, our Excel Chart Maker includes a full-featured ECharts JSON editor. This gives you complete access to the entire ECharts option schema - enabling features like custom series configuration, tooltip formatting, responsive resizing, animation tuning, and more. Perfect for precise control and fine-tuning.
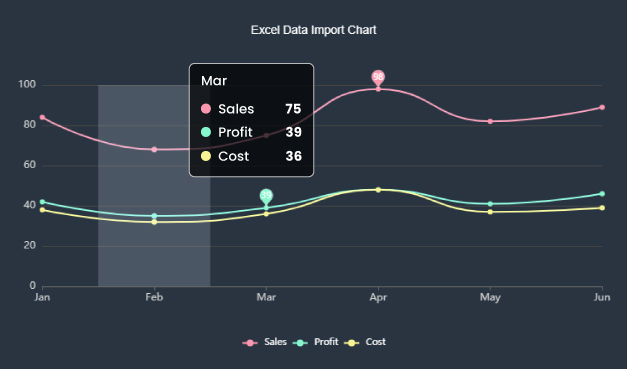
Built-in MarkPoint, MarkLine
Highlight key data points like maximums, minimums, and averages directly within your chart using intuitive controls. The Excel Chart Maker makes it easy to add ECharts markPoint, markLine, and markArea settings without writing code - great for drawing attention to trends, anomalies, or critical values.

Personalized Customization
Customize every part of your chart - from legend position to axis labels, series colors, and tooltip behavior - with a beautiful, easy-to-use interface. Built-in color pickers let you brand your charts visually. The Excel Chart Maker ensures your visualizations always look professional and on-brand.
FAQs for Free Excel Chart Generator
01
What is an Excel Chart Generator?
Excel Chart Generator is a web-based tool that lets you quickly convert Excel tables into interactive charts. You can paste data directly from Excel, edit it in a spreadsheet-like editor, choose from 13+ chart types, and customize everything - no coding required.
02
How do I import my Excel data?
Simply copy the table from your Excel file (or Google Sheets) and paste it directly into the chart editor. The tool automatically detects rows, columns, headers, and values.
03
Can I edit the data after pasting?
Yes! You can edit the data inside a built-in Excel-style table editor. It supports:
- Cell editing
- Drag-to-fill
- Multi-cell selection
- Keyboard navigation
- Undo/redo
04
Do I need to install anything?
No installation is required. Excel Chart Generator is a fully online tool — just open it in your browser and start creating charts instantly.
07
Is my data saved anywhere?
No. For privacy and security, your data is processed locally in the browser and not stored on our servers - unless you choose to export or share it.
08
Can I change chart colors, legends, and labels?
Yes. You can fully customize chart appearance, including:
- Series colors (via color picker)
- Legend position and visibility
- Axis names and labels
- Tooltips and value formatting
09
Can I edit the ECharts JSON config directly?
Yes! If you're familiar with ECharts, open the JSON editor to view or edit the full option object. This gives you full control over chart behavior, styling, and advanced features.
10
Can I use this tool for production dashboards?
Absolutely. You can export the ECharts JSON and integrate it into your own site or app. Or embed the generated chart via iframe, perfect for dashboards, reports, blogs, and Notion pages.