Create Maslow’s Hierarchy of Needs Pyramid with AI
Introduction to Pyramid Charts
Pyramid charts are an unique way to represent hierarchical structures, showcasing the relationship between different levels of a system. They are widely used in various fields such as psychology, business, and ecology to illustrate concepts that build upon one another.
Some Pyramid Charts
There are several types of pyramid charts, each serving a distinct purpose:
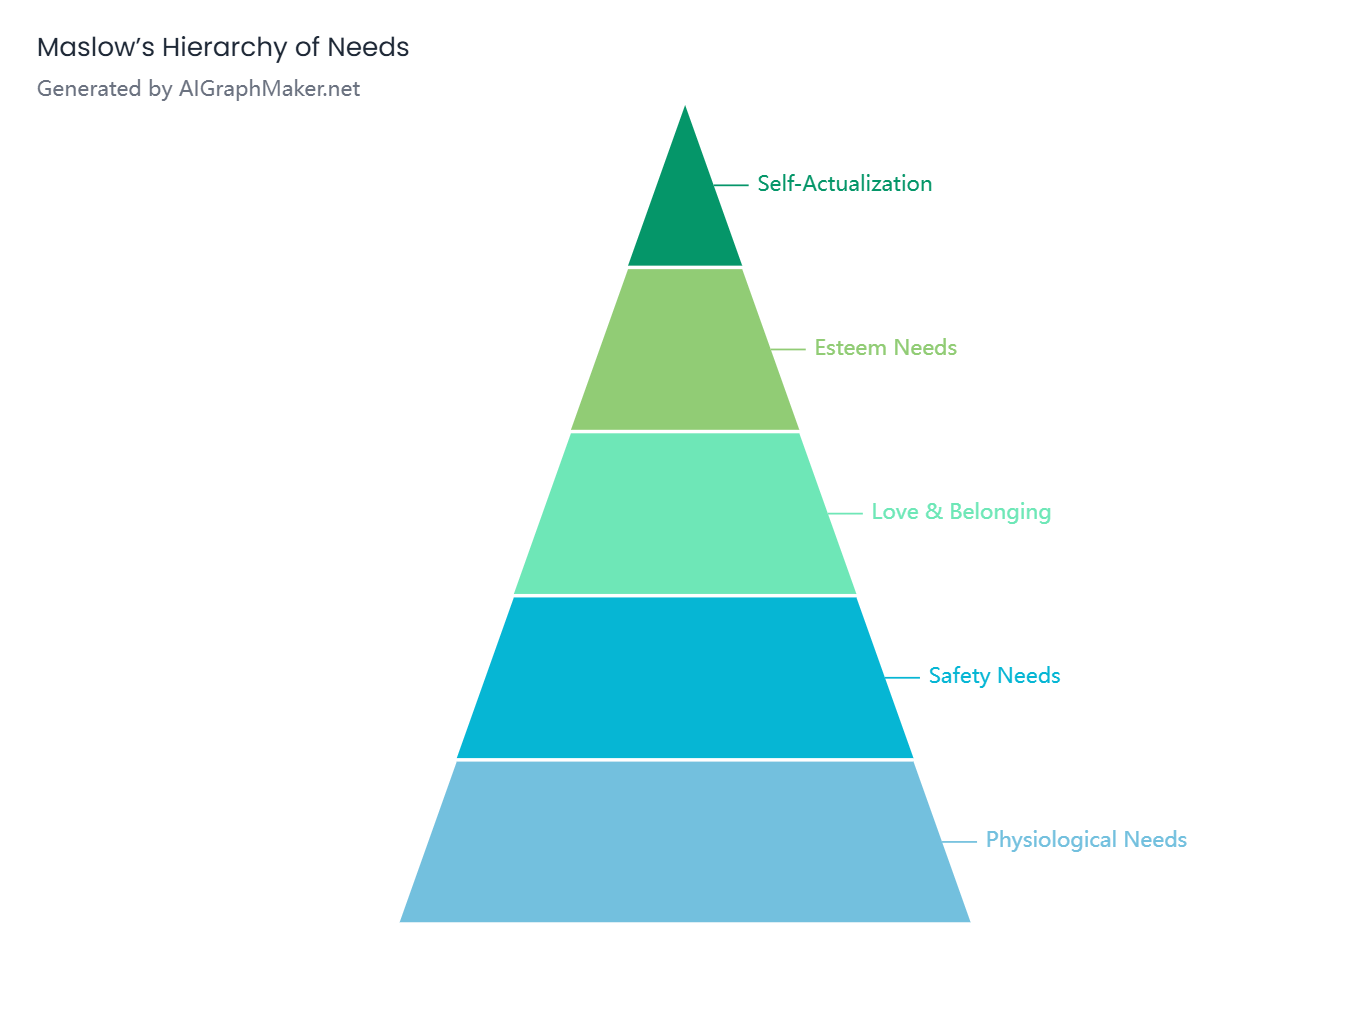
Maslow’s Hierarchy of Needs – A psychological model that categorizes human needs into five levels, ranging from basic physiological needs to self-actualization. more details
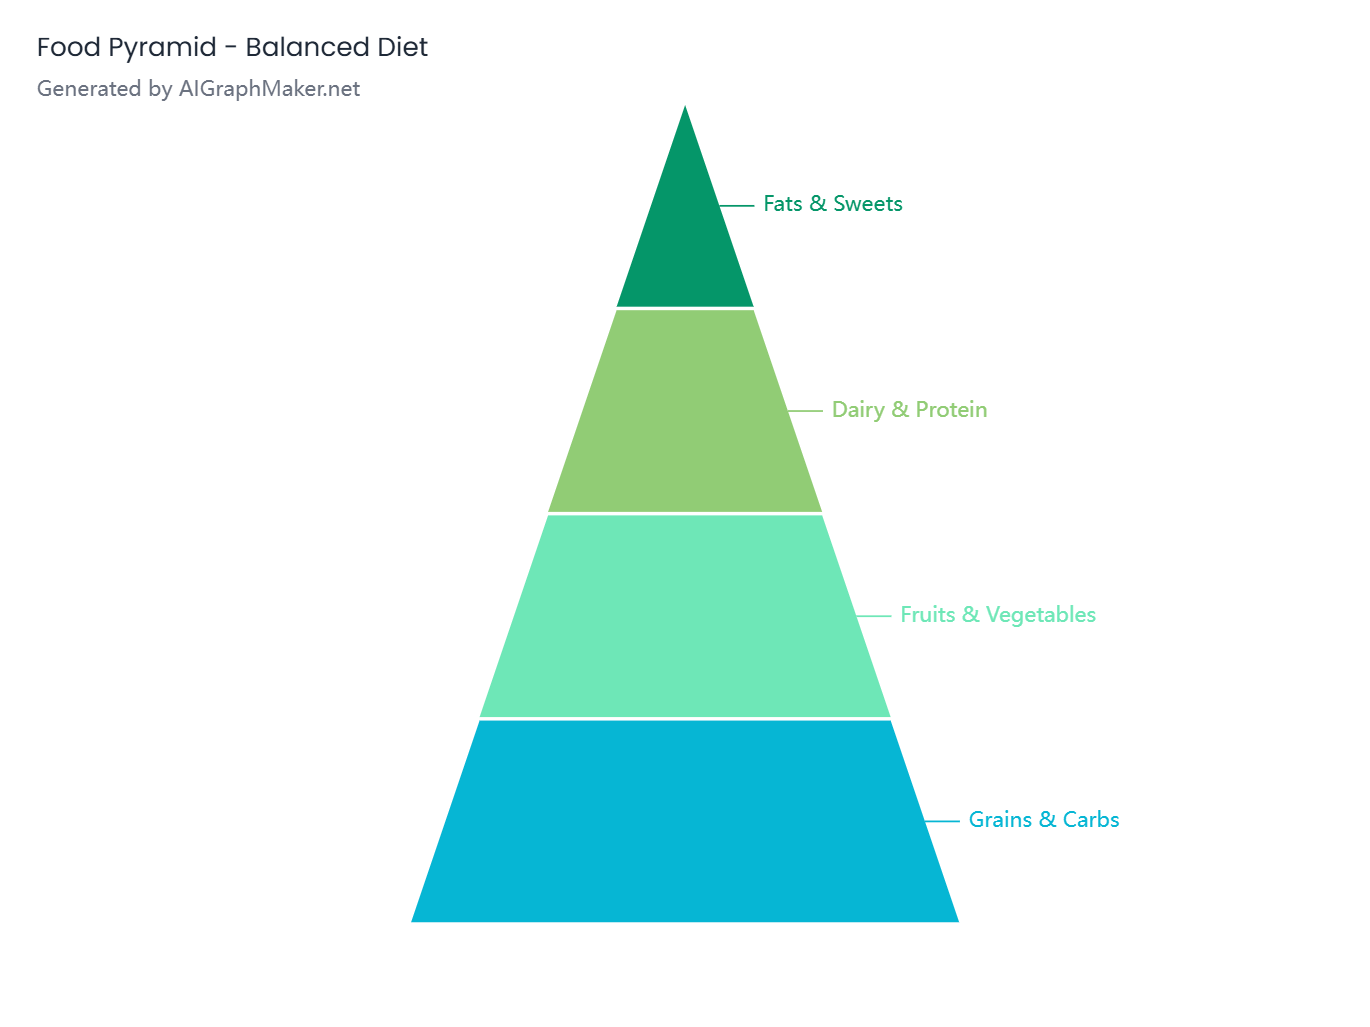
Food Chain Pyramid – A representation of the energy transfer in an ecosystem, from primary producers to top predators.
Sales Funnel Pyramid – A business-oriented pyramid illustrating the stages of customer conversion, from awareness to purchase.
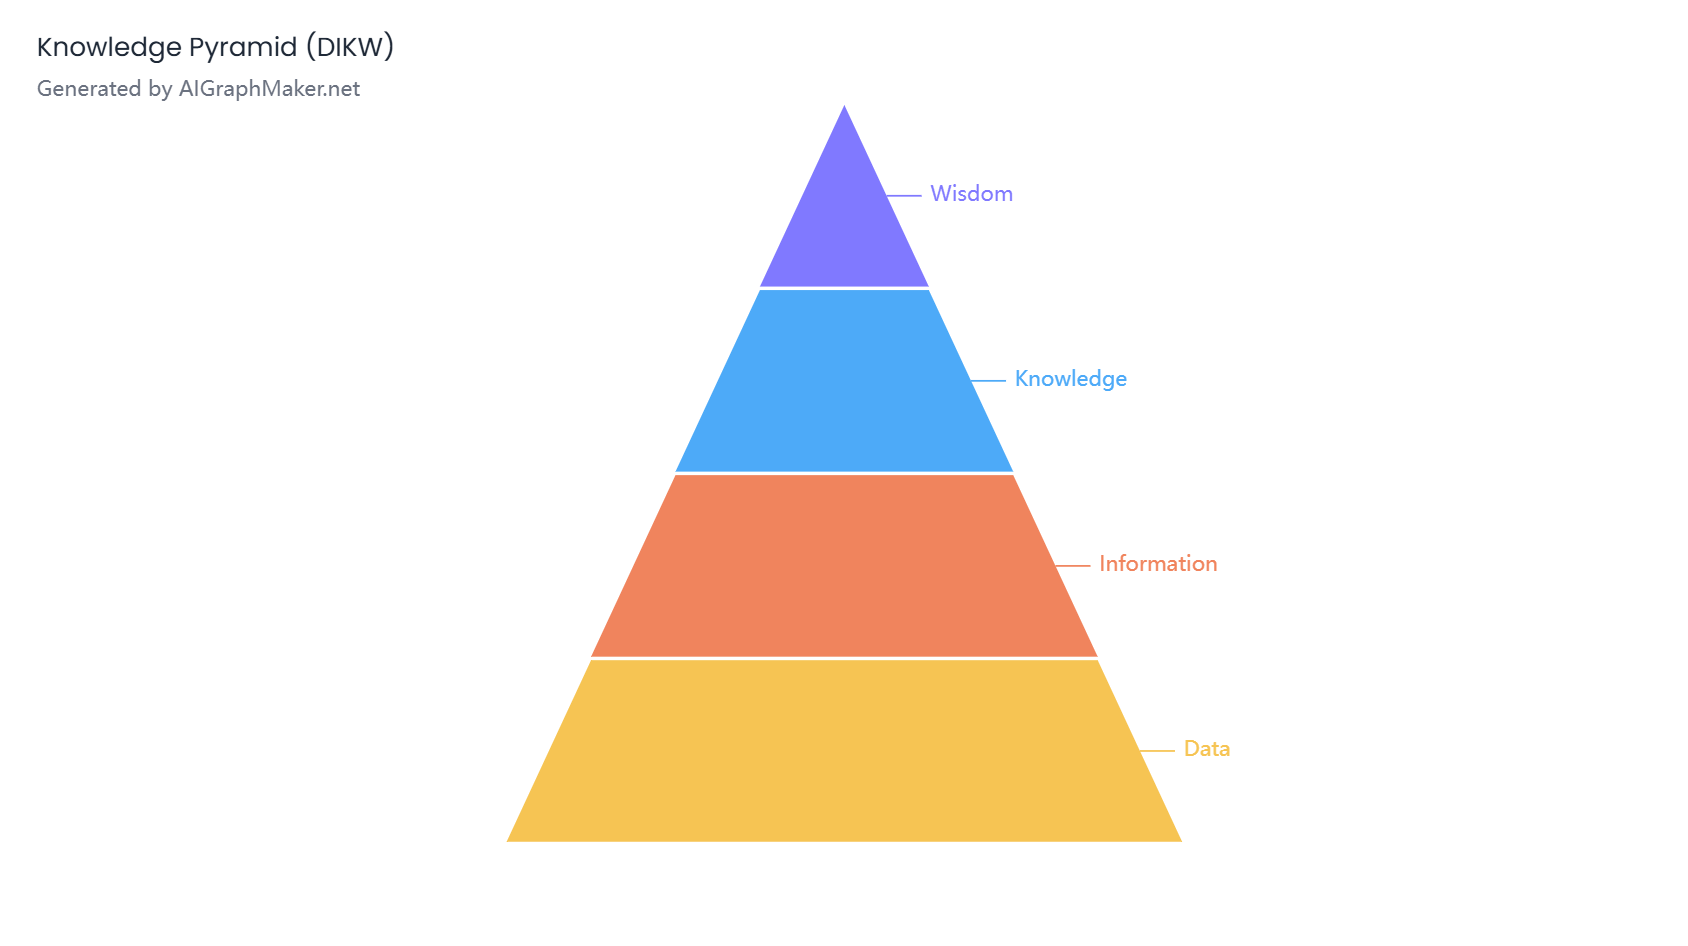
Knowledge Pyramid (DIKW) – A structure representing the transformation from raw data to wisdom. read more
Creating a Pyramid Chart with AI
With advancements in AI, generating pyramid charts has become more easily.
such as SmartDraw, AIGraphMaker.net , these tools allow users to create customized pyramid charts with ease.
Steps to Create a Maslow’s Pyramid Using AI
- Input Your Prompt – Provide a detailed description of the pyramid you want to generate, such as: "Create a five-level pyramid chart representing Maslow's Hierarchy of Needs, with labels for each level and a gradient color scheme."
- Generate the Result – The AI processes your input and renders a visually appealing pyramid chart.
- Customize and Download – Modify colors, labels, or dimensions as needed and download the final chart for use in presentations, reports, or educational materials.
Conclusion
AI tools have revolutionized the way we create visual data representations. Whether you need a Maslow’s pyramid for psychology studies or a food chain pyramid for biology lessons, platforms like aigraphmaker.net simplify the process, making data visualization efficient and effective.