? Release Announcement: ECharts Supported
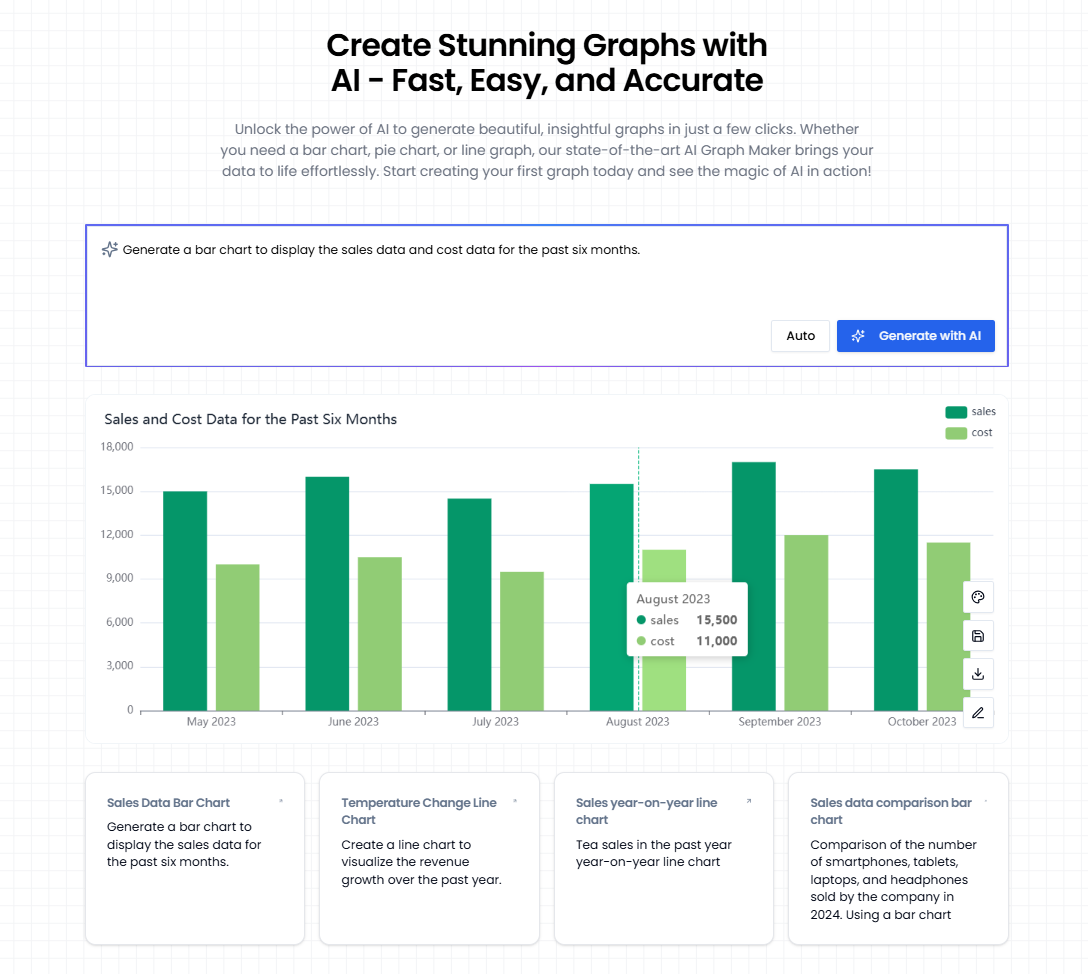
We are thrilled to announce a major upgrade to AI Graph Maker: ECharts Chart Support is now live! This exciting release empowers users with advanced, interactive, and customizable charts for all your data visualization needs.
1. Create ECharts Easily
With this release, AI Graph Maker now supports the generation of ECharts. Here’s what you can create in just a few clicks:
- Bar Charts: Compare data categories visually.
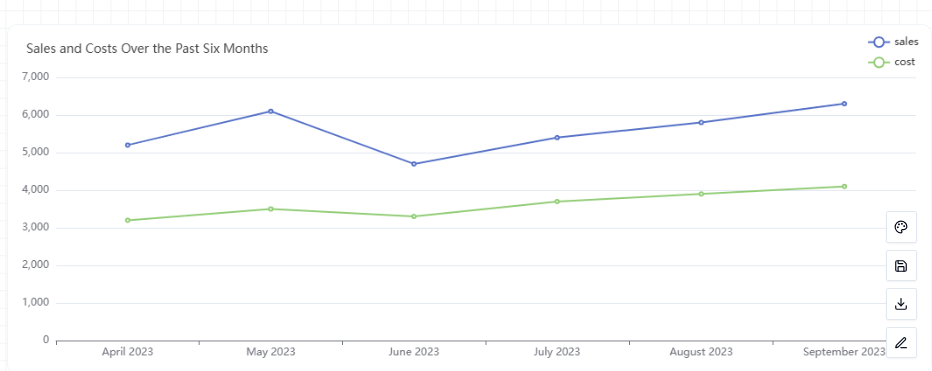
- Line Charts: Showcase trends over time.
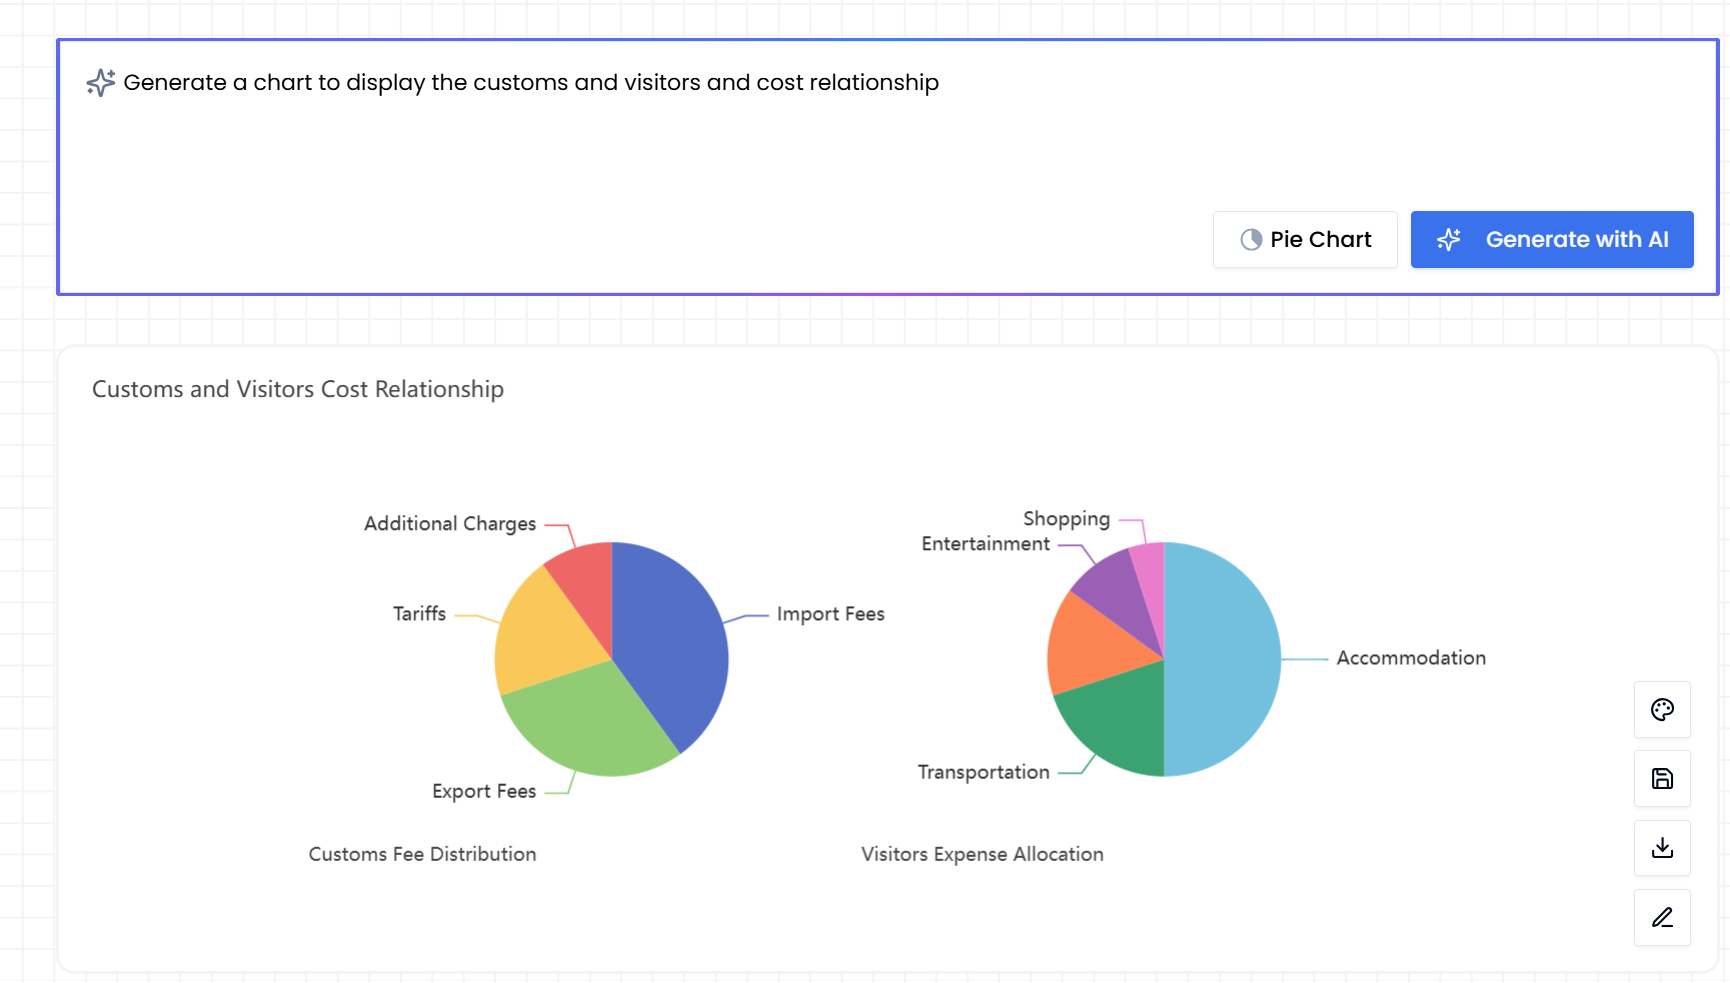
- Pie Charts: Represent proportions beautifully.
- Scatter Plots: Explore relationships between variables.
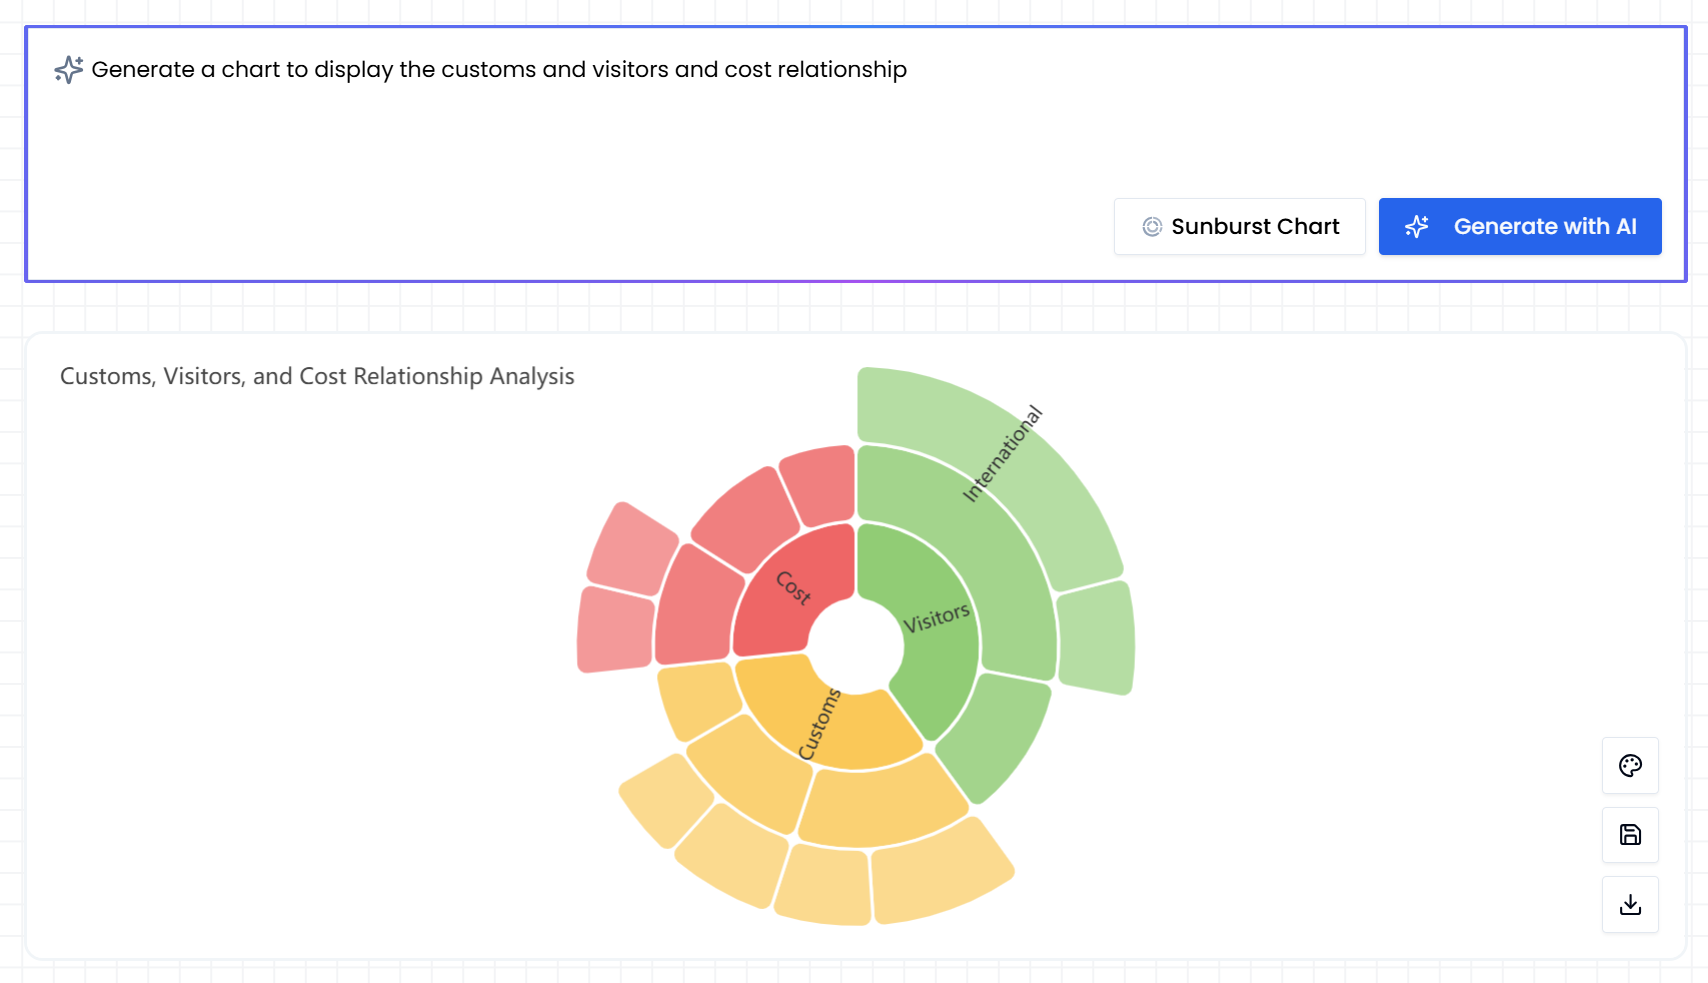
- Sunburst Charts: Visualize hierarchical data in a compact format.
- Sankey Diagrams: Represent flows and connections effectively.
- Tree Diagrams: Display hierarchical structures clearly.
- Graph Diagrams: Create networks and relationships with ease
2. Explore Rich ECharts Features
ECharts comes packed with advanced visualization capabilities, including:
- Wide Variety of Types: From basic to advanced chart types, there's a solution for every dataset.
- Dynamic Data Integration: Connect real-time or static datasets seamlessly.
- Custom Colors and Themes: Match your brand or presentation effortlessly.
- Interactive Elements: Enable zooming, panning, tooltips, and drill-downs to engage your audience.
- Responsive Design: Charts look stunning on any device.
3. AI Integration for Auto-Creation
We’ve made chart-making even smarter:
- Describe your data in plain text, and our AI will automatically create the perfect chart for you.
- Save time by skipping complex configurations—our AI knows what works best.
4. Snapshots for Sharing
Generate high-quality image snapshots of your charts instantly. Perfect for presentations, reports, and sharing across platforms.


Get Started Now!
Creating stunning, interactive charts has never been this easy. Whether you're visualizing trends, hierarchies, or networks, AI Graph Maker + ECharts has you covered.