Effortless Gantt Chart Creation with Gantt Graph Maker AI

Features of Ganntt Chart

Task Visualization

Task Visualization

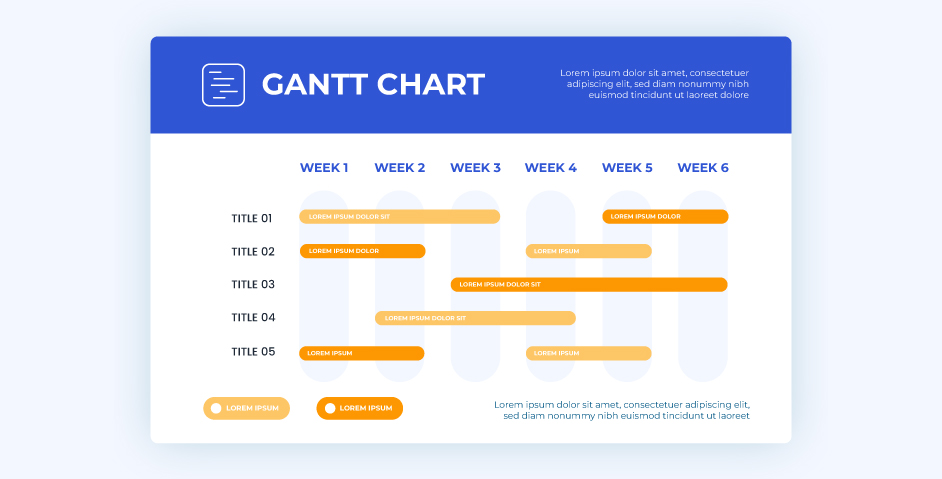
AI Graph Maker’s Gantt Chart visually represents task durations with bar lengths. The position of each bar on the timeline shows the start and end times of tasks, giving a clear project timeline overview.
Task Dependencies

Task Dependencies

With AI Graph Maker’s Gantt Chart, task dependencies are clearly displayed. It ensures tasks start only after their dependencies are completed, optimizing workflow and avoiding delays.
Progress Tracking

Progress Tracking

AI Graph Maker’s Gantt Chart allows for easy progress tracking with color coding or percentage indicators. Project managers can quickly identify tasks that are completed, in progress, or behind schedule.
Resource Allocation

Resource Allocation

AI Graph Maker’s Gantt Chart helps project managers allocate resources effectively. It prevents team members from being overburdened, ensuring balanced workloads across the project.
Communication Tool

Communication Tool

AI Graph Maker’s Gantt Chart serves as a universal communication tool. It ensures that all team members are aligned and have a shared understanding of project progress.
Critical Path Identification

Critical Path Identification

AI Graph Maker’s Gantt Chart identifies the critical path of a project. It highlights the essential task sequence that determines whether the project will be completed on time, ensuring efficient delivery.

How to Create a Gantt Chart with AI Graph Maker

Easily create your own Gantt Chart using the powerful features of AI Graph Maker by following these simple steps.
01

Input Your Data

Add your project data into AI Graph Maker to get started with your Gantt Chart.
02

Generate Your Gantt Chart

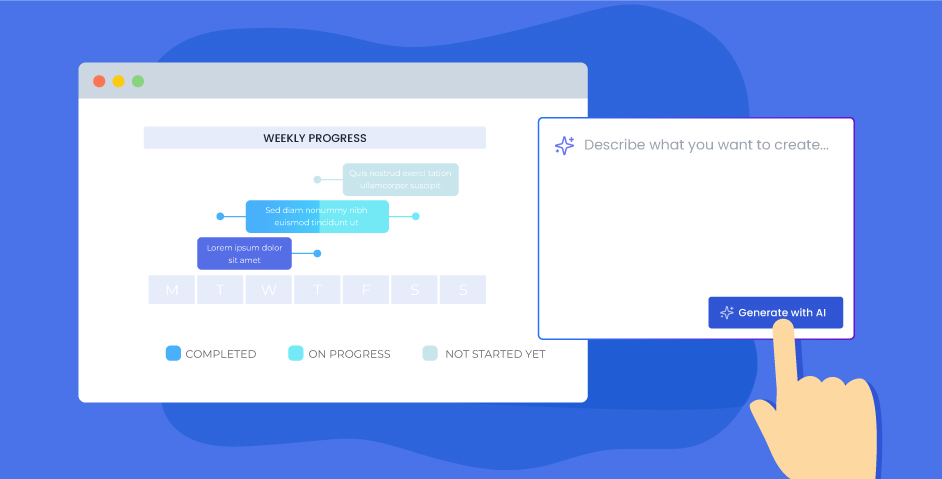
Click "Generate with AI" to effortlessly create your Gantt Chart using the power of AI Graph Maker.
03

Customize Your Chart

Personalize the Gantt Chart by adjusting colors, labels, and other features to fit your project needs.
04

Save and Share

Download your Gantt Chart (such as PNG/SVG/Mermaid) or share it directly using AI Graph Maker to collaborate with your team.
Quick-and-Automated-Gantt-Chart-Creation.jpg

Quick and Automated Gantt Chart Creation

With AI Graph Maker, users can effortlessly generate a Gantt Chart in no time. The tool automates the process, eliminating the need for manual chart creation, and helps users quickly start planning and managing their projects.

Fully-Customizable-Design.jpg

Clear Task Visualization

AI Graph Maker's Gantt Chart provides a clear, visual representation of project timelines. It shows the start and end times for each task, along with task dependencies, giving users an immediate overview of project progress and workflow management.

Smart-Task-Scheduling-Optimization.jpg

Smart Task Scheduling Optimization

The AI Graph Maker tool intelligently analyzes project data and optimizes task scheduling. It automatically adjusts task order and dependencies, ensuring that projects stay on track and are completed on time, while minimizing human error.
Customizable-and-Flexible-Gantt-Charts.jpg

Customizable and Flexible Gantt Charts

With AI Graph Maker, users can fully customize their Gantt Chart to match project needs. Adjust colors, labels, and other design elements for a personalized chart that fits the project’s unique requirements, offering maximum flexibility.