[Video Demo] Radar Chart or Spider Chart Creation
Graph maker (aigraphmaker.net) is an intuitive and powerful tool for generating AI-assisted charts, including radar charts (also known as spider charts). A radar chart is a great way to visualize multivariable data across several groups, making it ideal for comparing different categories or performance metrics. With aigraphmaker.net, you can create beautiful, fully customizable radar charts in just a few steps.
To get started, visit the website (https://aigraphmaker.net/radar-chart-maker) and select the radar chart option from the menu.
You’ll be guided to input your data for each category and group.
For example, you can compare metrics such as speed, agility, strength, stamina, and skill across different teams or individuals. The tool automatically analyzes the data and generates a high-quality radar chart, saving you time and effort.
please refer to the following snapshot:
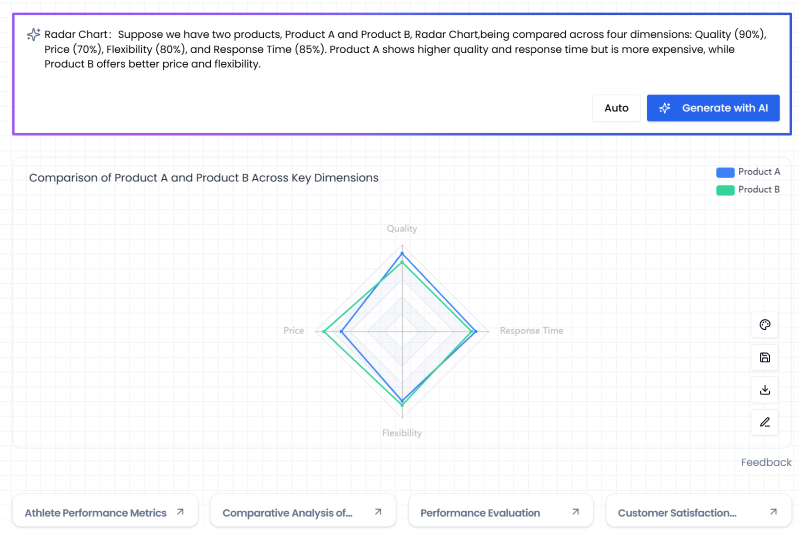
One of the standout features of aigraphmaker.net is its AI capabilities. The AI ensures your chart is optimized for clarity and presentation, adjusting colors, labels, and scales automatically. You can further customize the chart by modifying the titles, axis labels, and color schemes to match your preferences or brand style.
Whether you're a student, data analyst, or business professional, aigraphmaker.net simplifies the process of visualizing data. The generated radar charts are ready to download and share, perfect for reports, presentations, or embedding on websites. With no coding skills required, aigraphmaker.net makes advanced data visualization accessible to everyone.
Of coure, you can download it and save it to use in the furture.
Aslo, please check our tour video on youtube
Let me know if you want this in a more formal tone or shorter version!
More articles:
How to make radar chart in excel