Create an Excalidraw diagram for empirical relationship. Draw x and y axes and place 12 data points in a loose upward trend. Add a light trend line with a note that says observed pattern. Mark 2 outliers with small circles and labels. Add a side panel that lists three steps: collect data, plot points, read the pattern. Use a light grid, neutral colors, and clear labels for data, trend, and outlier. Include a short title at the top and keep the layout clean so the scatter points stand out.
Description
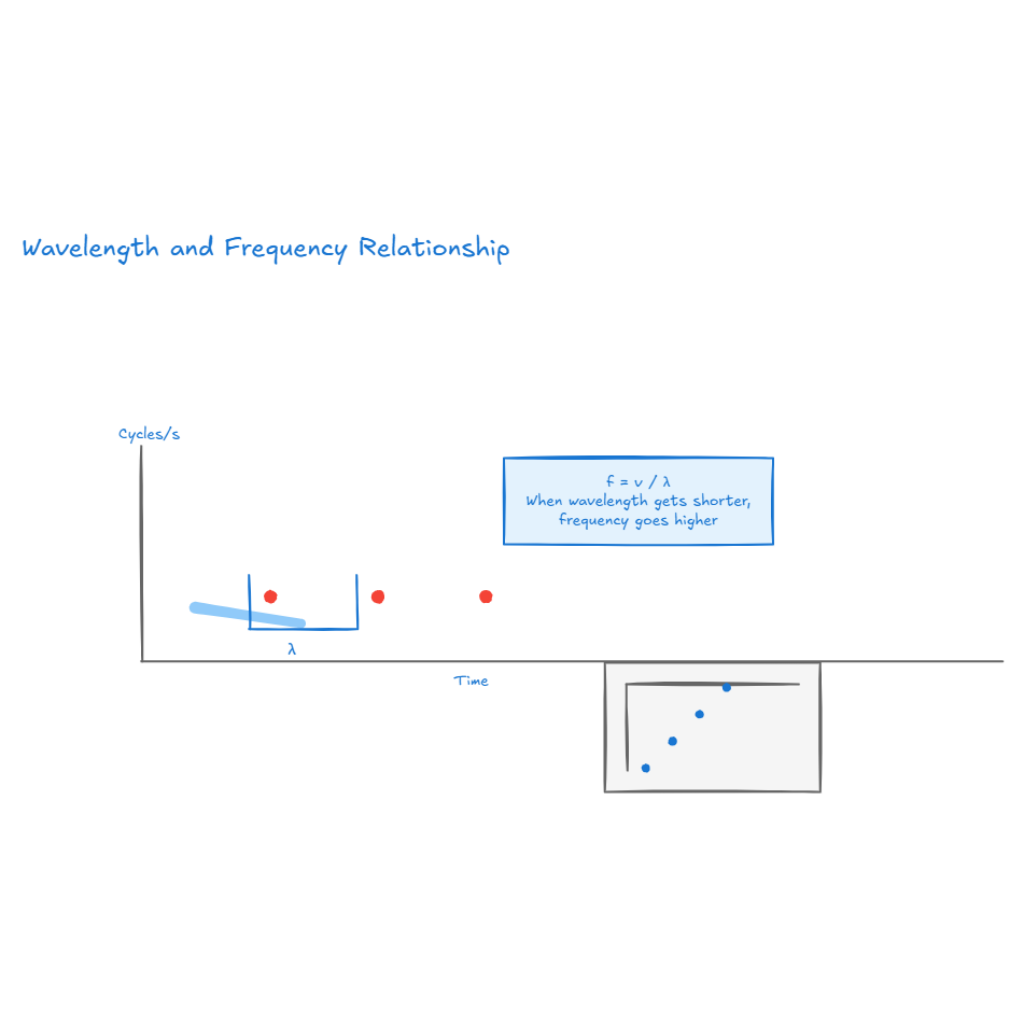
What is empirical relationship
empirical relationship is a pattern you can see in real data after you observe and measure. It does not start with a theory. It starts with points on a chart and the story they tell. A clear diagram can show 12 data points, 1 trend line, and 2 outliers so a reader sees the pattern in seconds. This makes the idea useful for reports, teaching, and quick reviews.
- Turn observations into a visible pattern
- Make data driven ideas easy to share
- Spot outliers without extra tools
- Keep explanations short and clear
Observed pattern
Observed pattern is the heart of an empirical relationship. If points move upward from left to right, you can say the two values rise together. A simple line and a short note are often enough to explain the trend.
When to use empirical relationship diagrams/charts
Use this chart when you have data from tests, surveys, or logs and need a quick summary. It works well for 10 to 30 data points and two variables. Teams use it for weekly updates, and teachers use it to explain how evidence supports a conclusion. A single page chart can replace long text and keep meetings focused.
Outlier check
Outlier check helps you see points that do not follow the main pattern. Mark 2 unusual points with circles and a short label so readers know they are exceptions. This keeps the chart honest and useful.
How to generate the empirical relationship (graph/diagram/chart/drawing)
Open the diagram generator and choose an Excalidraw layout. Draw axes, place dots, and add a light trend line. Label two outliers and add a small side panel with three steps like collect, plot, and read. Try prompt words like scatter pattern, data trend, and observed relation to explore new layouts.
Simple annotation
Simple annotation keeps attention on the data. Use short labels like trend and outlier and avoid long notes. This helps the viewer scan the chart in under 15 seconds.
Similar Prompt Examples
Here are three prompt ideas you can adapt for empirical relationship.
Draw a scatter chart with 10 to 15 points, a light trend line, and two labeled outliers.
Create a clean data pattern diagram with axes, grid lines, and a short observed pattern note.
Generate an Excalidraw scatter plot with a side panel that lists data collection steps.
FAQs
Do I need a lot of data to show an empirical relationship? No. Even 10 to 15 points can show a pattern if the data is clear. If you only have a few points, keep the chart simple and avoid strong claims. The goal is to show what you observed, not to prove a final rule.
Should I add a formula to the chart? Only if it helps the reader. Many charts work well with just a trend line and a short note. If you add a formula, keep it short and place it in a corner so it does not distract from the data points.
How do I decide if a point is an outlier? An outlier is a point that sits far away from the main cluster. Use a simple visual rule, not a complex calculation. Mark it with a circle and a short label so the reader knows it is different.
Can I use this chart in a report? Yes. A clear chart is a strong summary tool. Add a short caption and keep the layout clean. It helps readers understand the data quickly before they read detailed text.
What if the points do not show a clear pattern? Say that the relationship is weak or unclear. You can still show the chart and explain that the data does not point to a strong trend. This is valuable because it sets expectations.
Similar Links
1. Relationship between Height and Weight
2. Production Speed vs Defect Rate Relationship
3. Interrelationships between Scientific Disciplines
These references help you plan your next empirical relationship