Description
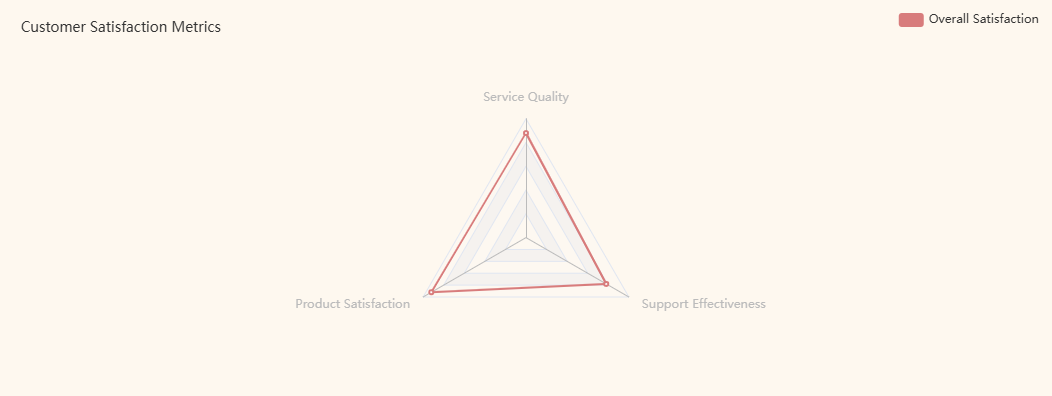
In the realm of sports analytics,Radar/Spider Charts serve as an invaluable tool for visualizing and comparing athletes' performance metrics.
Structure
Each axis of the radar chart represents a specific performance metric critical to athletic success. These may include speed, endurance, strength, agility, power, technical skill, and mental resilience. The center of the chart signifies the lowest level of performance, while the outer edge denotes the highest achievable standard.The points on each axis correspond to the athlete's measured or evaluated score in that particular metric.
Interpretation
By connecting the points across all axes, a polygon is formed, creating a unique performance profile for each athlete. This visual representation allows for quick identification of an athlete's strengths and weaknesses. For instance, an athlete with a higher point on the speed axis but a lower point on the endurance axis would exhibit a performance profile skewed towards speed but lacking in stamina.
Applications
Coaches and trainers utilize radar charts to design personalized training programs. They can target the specific areas where an athlete needs improvement. Scouts and recruitment personnel also benefit from these charts when evaluating potential talent, as they can compare multiple athletes' profiles at a glance and determine how well an athlete's attributes align with the requirements of a particular position or role within a team.
In summary, radar/spider charts provide a comprehensive and intuitive visual summary of athletes' performance metrics, aiding in training, evaluation, and decision-making processes within the sports domain.