Description
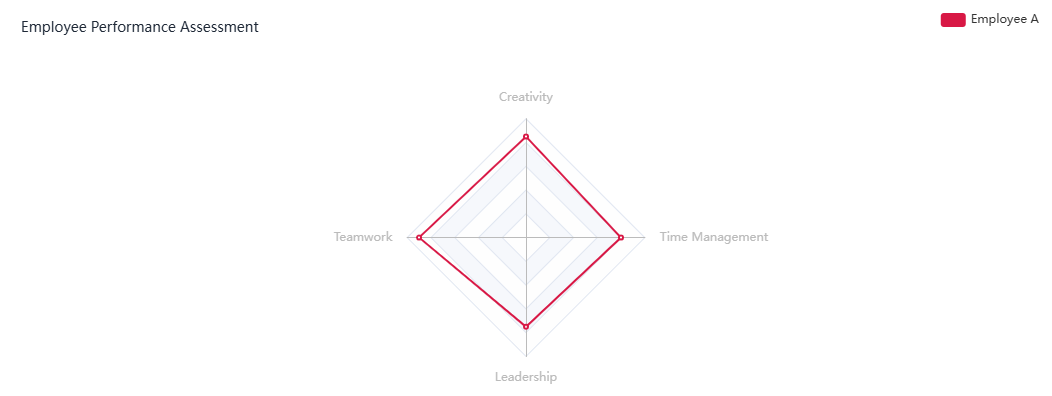
A radar/spider chart designed for customer satisfaction metrics presents a multi - dimensional view of how a business is perceived by its customers.
Each axis corresponds to a specific aspect of customer satisfaction. Common metrics include product quality, service experience, value for money, ease of use, customer support responsiveness, brand loyalty, and likelihood to recommend. The center of the chart indicates the lowest satisfaction level, while the outermost edge represents complete customer satisfaction. Points along each axis reflect the ratings gathered from customer feedback surveys or other evaluation methods.
Interpretation
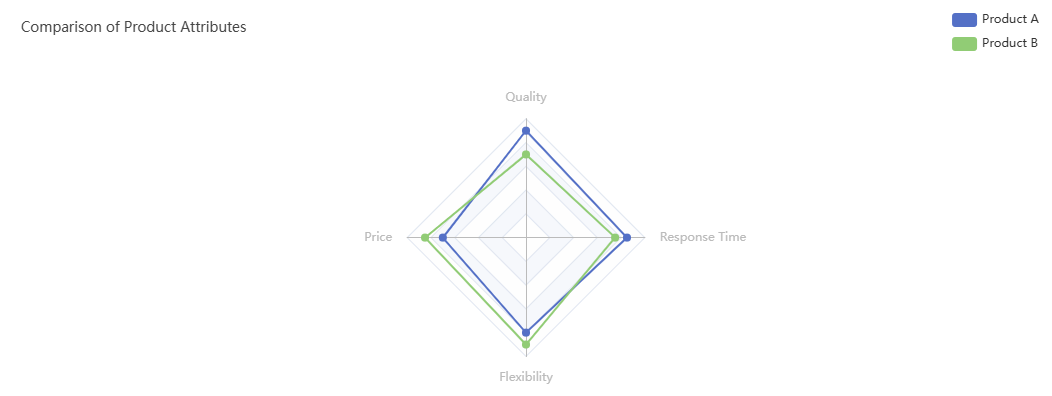
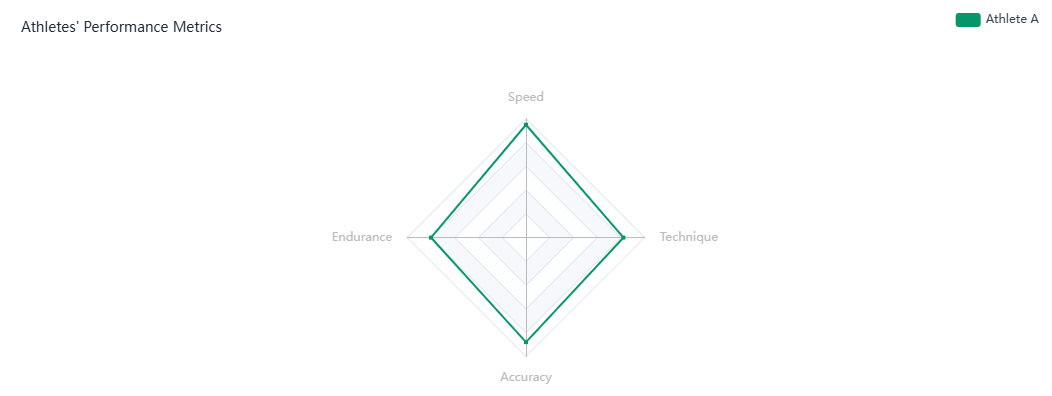
The radar chart creates a visual "satisfaction footprint" by connecting the data points across all axes. An ideal chart would have a shape that is well - rounded and close to the outer edge across all axes, indicating balanced and high - level customer satisfaction. However, in reality, the shape often has peaks and valleys.
Peaks signify areas where the business excels. For example, if the point on the "product quality" axis is near the outer edge, it suggests that customers are highly satisfied with the quality of the products offered.
Valleys, conversely, point to problem areas. If the "customer support responsiveness" axis has a low point, it reveals that customers are dissatisfied with how quickly their issues are addressed by the support team. This visual representation makes it easier for businesses to quickly identify which areas need urgent attention and improvement.
Applications
Businesses leverage this chart to enhance their customer - centric strategies. It helps in prioritizing resources and efforts to address the most critical pain points identified through the valleys in the chart.
Marketing teams can utilize the insights to highlight the business's strengths in their campaigns. For instance, if product quality is a peak, it can be showcased as a key selling point.
Moreover, tracking the changes in the radar chart over time enables businesses to assess the effectiveness of implemented improvements and monitor shifts in customer preferences.
In essence, a radar/spider chart of customer satisfaction metrics is a powerful tool that offers a concise yet comprehensive visual summary of various facets of customer satisfaction, driving data - informed decisions to提升 customer experience and loyalty.