Description
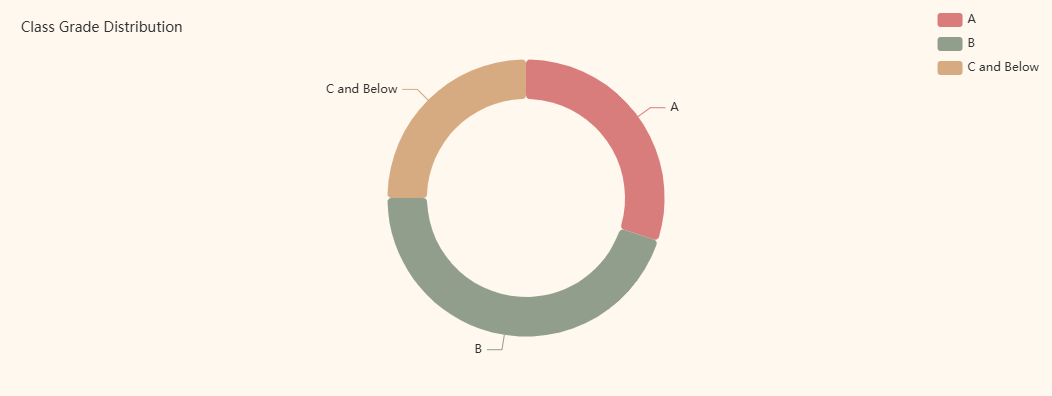
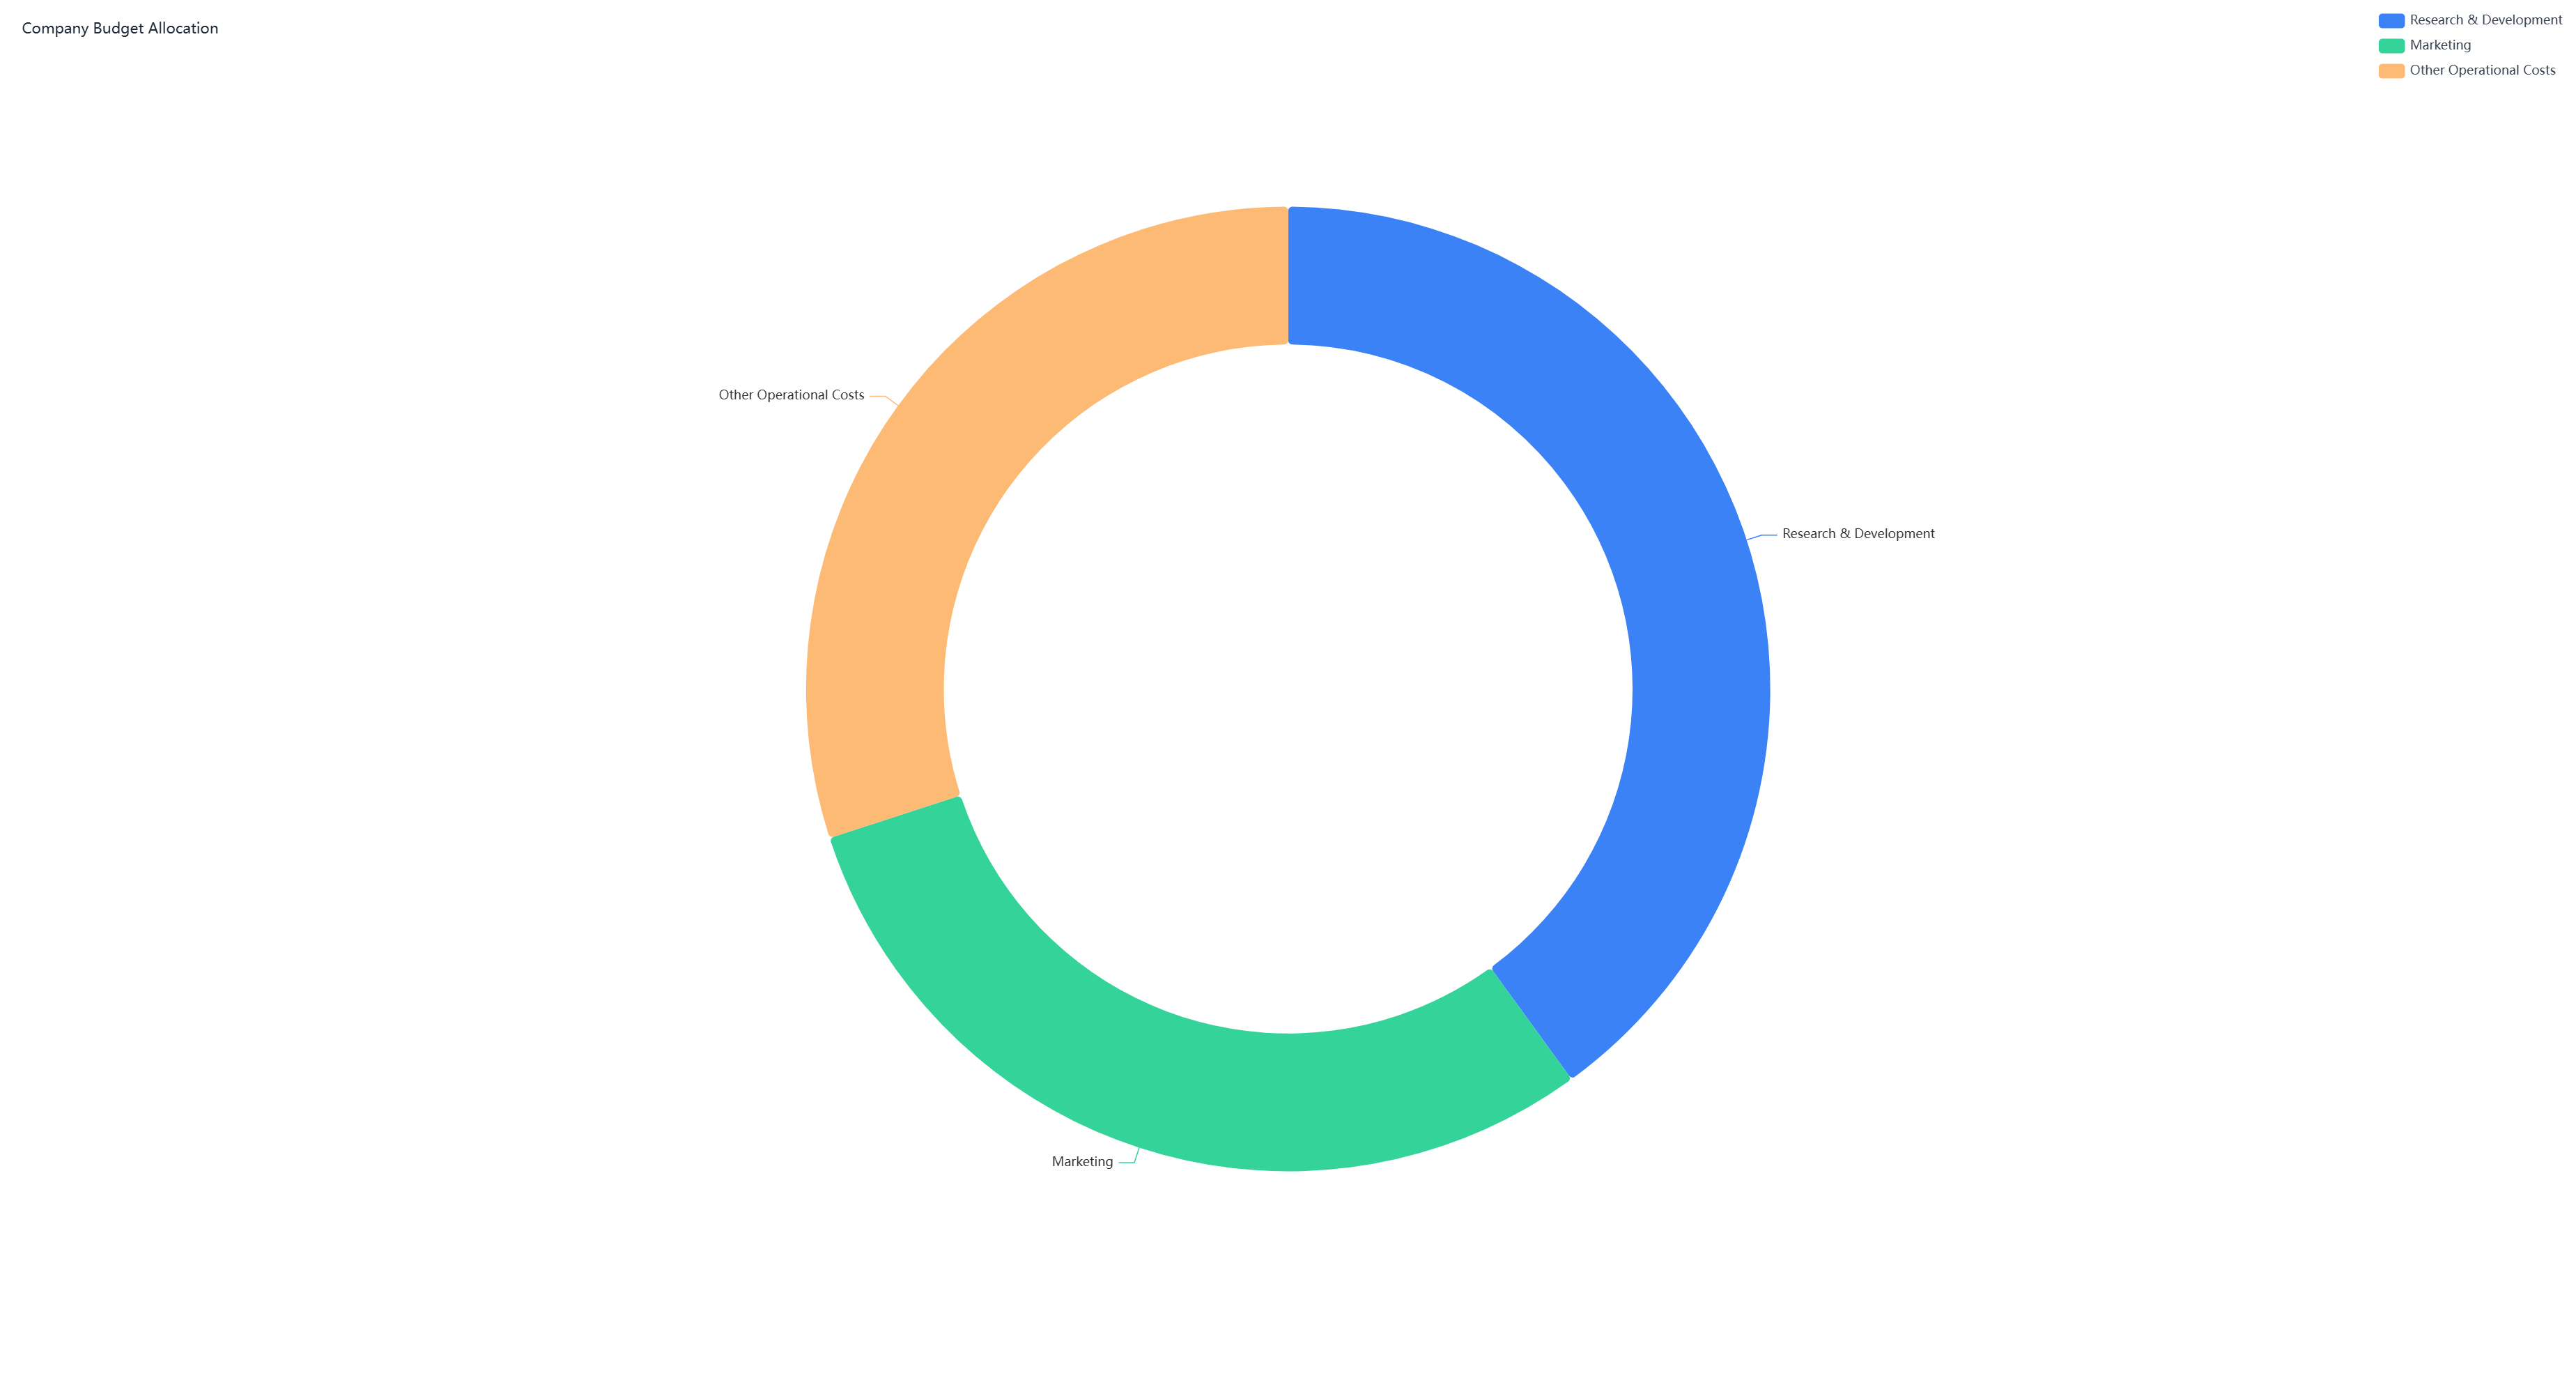
The doughnut chart for patient demographics breakdown is a simple yet powerful data visualization tool used in healthcare settings to display the distribution of patients across different demographic categories. The chart consists of a doughnut - shaped ring divided into several segments, with each segment representing a specific demographic group. These groups are typically based on factors such as age, gender, race, ethnicity, or geographical location. The size of each segment is proportional to the percentage of patients within that particular demographic category. For example, if 40% of the patients are male and 60% are female, the doughnut chart will have two segments, with the male segment taking up 40% of the ring and the female segment taking up 60%. Each segment is color - coded and labeled with the corresponding demographic category and percentage value to enhance clarity.
Interpretation and Applications
This chart offers a quick and intuitive way to understand the composition of a patient population. Healthcare providers can use it to identify which demographic groups are most prevalent among their patients. For instance, if a significant portion of patients belongs to a certain age group, it may indicate the need for specialized services or resources tailored to that age group's specific healthcare needs. It also helps in detecting disparities in healthcare access or outcomes. If one racial or ethnic group is underrepresented, it might suggest potential barriers to healthcare utilization that need to be addressed.
Moreover, the doughnut chart serves as a useful communication tool for healthcare administrators and policymakers. It can be included in reports or presentations to visually convey the diversity of the patient population and support data - driven decision - making. For example, when applying for grants or allocating budgets, showcasing the demographic breakdown can help justify the need for certain programs or resources aimed at specific patient groups.
In summary, the doughnut chart for patient demographics breakdown is an effective visual aid that provides valuable insights into the patient population's characteristics. It helps healthcare organizations better understand their patients, allocate resources appropriately, and work towards providing equitable and targeted healthcare services.