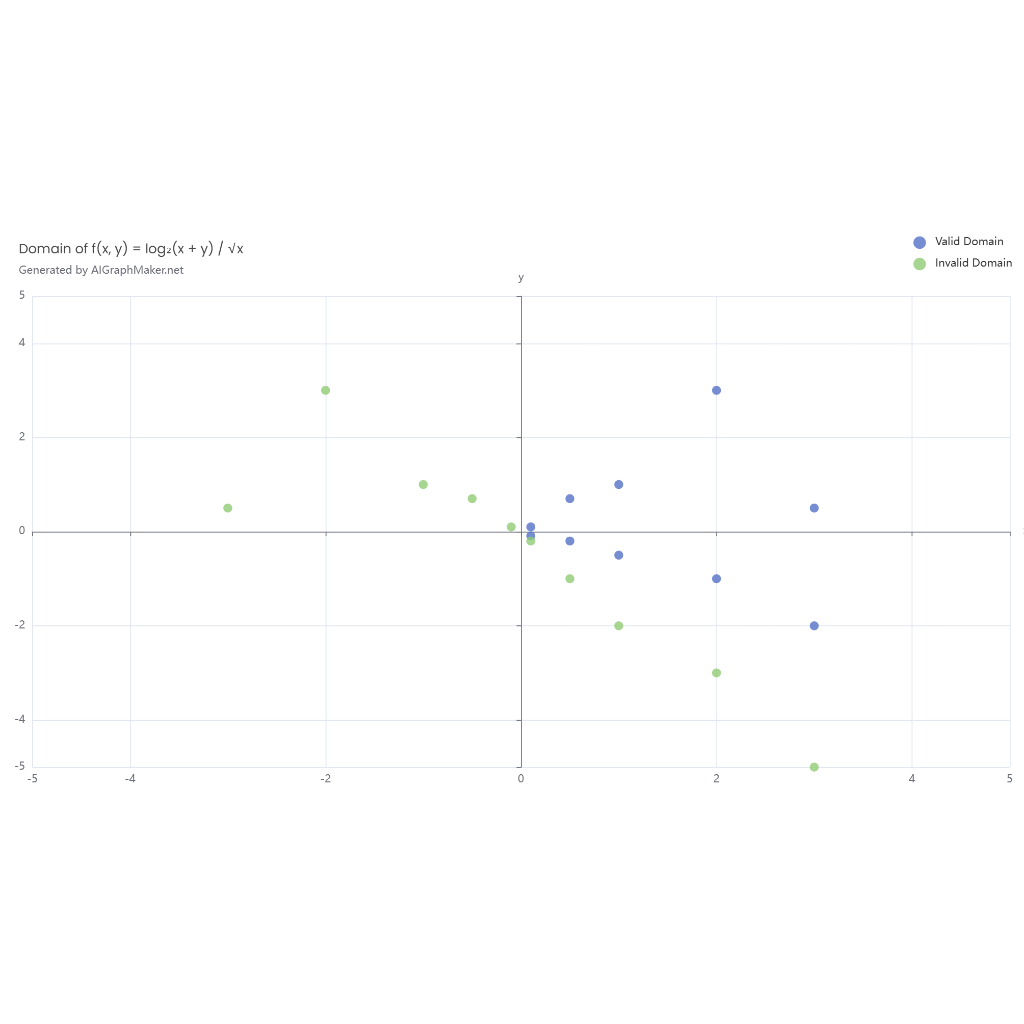
Create a scatter plot using GraphMaker to visualize the relationship between bid quotes, evaluation benchmark price, bid scores, and rankings based on the following data:
- X-axis: Bid quotes in yuan (e.g., 18718800.00 for "重庆太和空调自控有限公司", 17882292.00 for "深圳华龙讯达信息技术股份有限公司", etc.)
- Y-axis: Bid scores (e.g., 28.06 for "重庆太和空调自控有限公司", 29.77 for "深圳华龙讯达信息技术股份有限公司", etc.)
- Point color: Rankings (1 to 12, e.g., 4 for "重庆太和空调自控有限公司", 1 for "深圳华龙讯达信息技术股份有限公司"; use a gradient from green for rank 1 to red for rank 12)
- Point size: Fixed size for readability (e.g., medium size)
- Add a horizontal reference line at 18019391.42 labeled as "Evaluation Benchmark Price".
- Include data labels next to each point showing the bidder names (e.g., "重庆太和空调自控有限公司", "深圳华龙讯达信息技术股份有限公司", etc.).
- Data:
- "重庆太和空调自控有限公司", 18718800.00, 28.06, 4
- "深圳华龙讯达信息技术股份有限公司", 17882292.00, 29.77, 1
- "珠海派诺科技股份有限公司", 19185580.00, 26.76, 6
- "郑州益盛工程科技有限公司", 12600000.00, 20.98, 11
- "凯特智能控制技术有限公司", 20421500.00, 23.33, 10
- "北京航天拓扑高科技有限责任公司", 18521568.00, 28.61, 2
- "北京中电红石科技股份有限公司", 12008900.00, 19.99, 12
- "上海泷得自动化技术有限公司", 17060000.00, 28.40, 3
- "北京康孚科技股份有限公司", 18960000.00, 27.39, 5
- "成都千嘉科技股份有限公司", 20390367.00, 23.42, 9
- "超网实业(成都)股份有限公司", 20204300.00, 23.94, 7
- "贵州汇通华城股份有限公司", 20279390.00, 23.73, 8
- Design: Use a light gray background, black axis lines, and a clear font (e.g., Arial). Ensure the plot is titled "Bid Quote vs Score with Benchmark Price and Ranking".
- Ensure the chart is readable with sufficient spacing between points and labels.
Added on:
Feb 26, 2025
User Prompt
