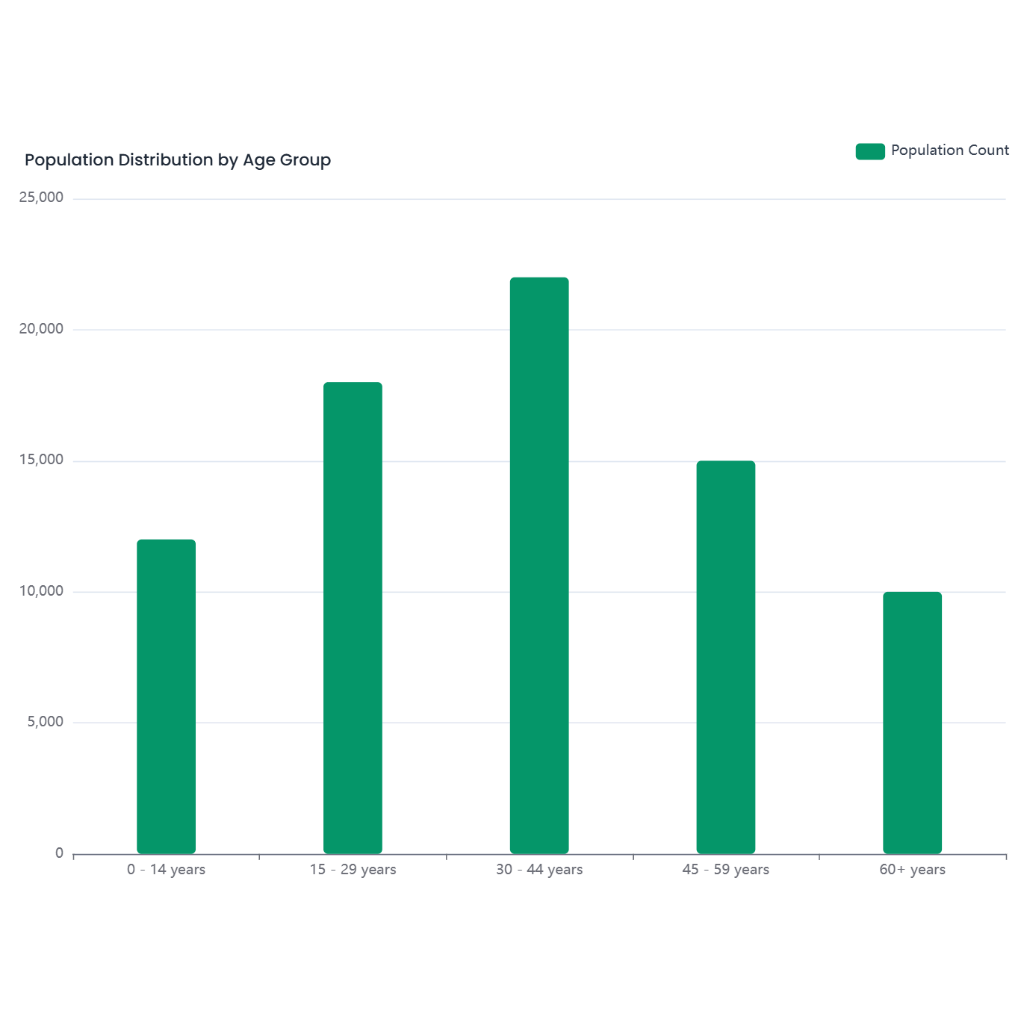
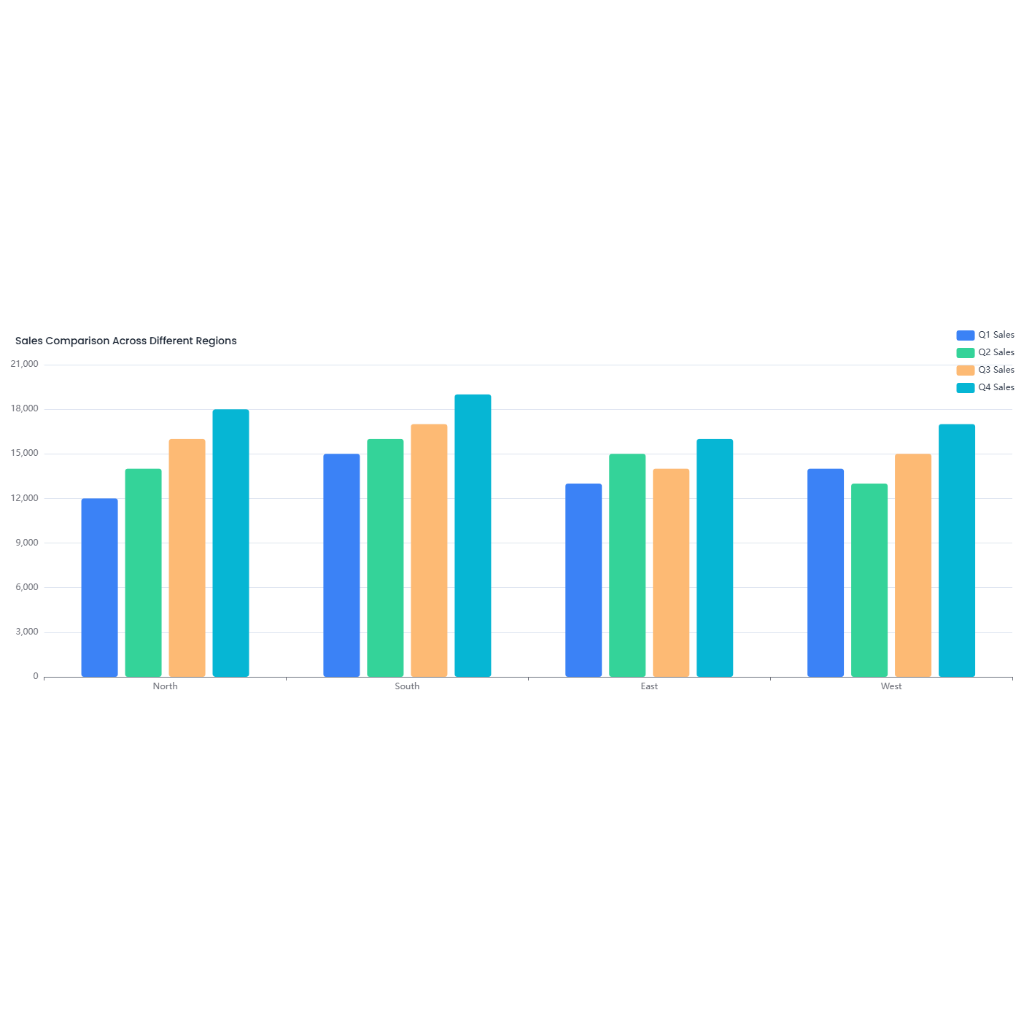
To create a graph representing the cash flows and their present values over time, you can use a combination of bar charts or line graphs. Here's how you might visualize this data:
Graph Description
X-axis: Represent the years from Year Zero to Year Three.
Y-axis: Represent the cash flows and present values in dollars.
Graph Components
Cash Flows:
Use a bar chart to show the cash flows at each year. The initial investment of $52,000 at Year Zero should be represented as a negative bar (below the x-axis), while the cash inflows of $17,000, $23,000, and $30,000 should be positive bars (above the x-axis).
Present Values:
You can either use another set of bars or a line graph to show the present values of the cash flows. The present values are approximately $15,741, $19,719, and $23,815 for Years One, Two, and Three, respectively. There is no present value for the initial investment since it's already at its present value (the cost).
NPV Line:
Optionally, you could include a horizontal line representing the NPV of approximately $7,274.50. However, this might not be directly comparable in the same scale as the cash flows and present values, so it might be better to annotate it or display it separately.
