Added on:
Mar 06, 2025
User Prompt
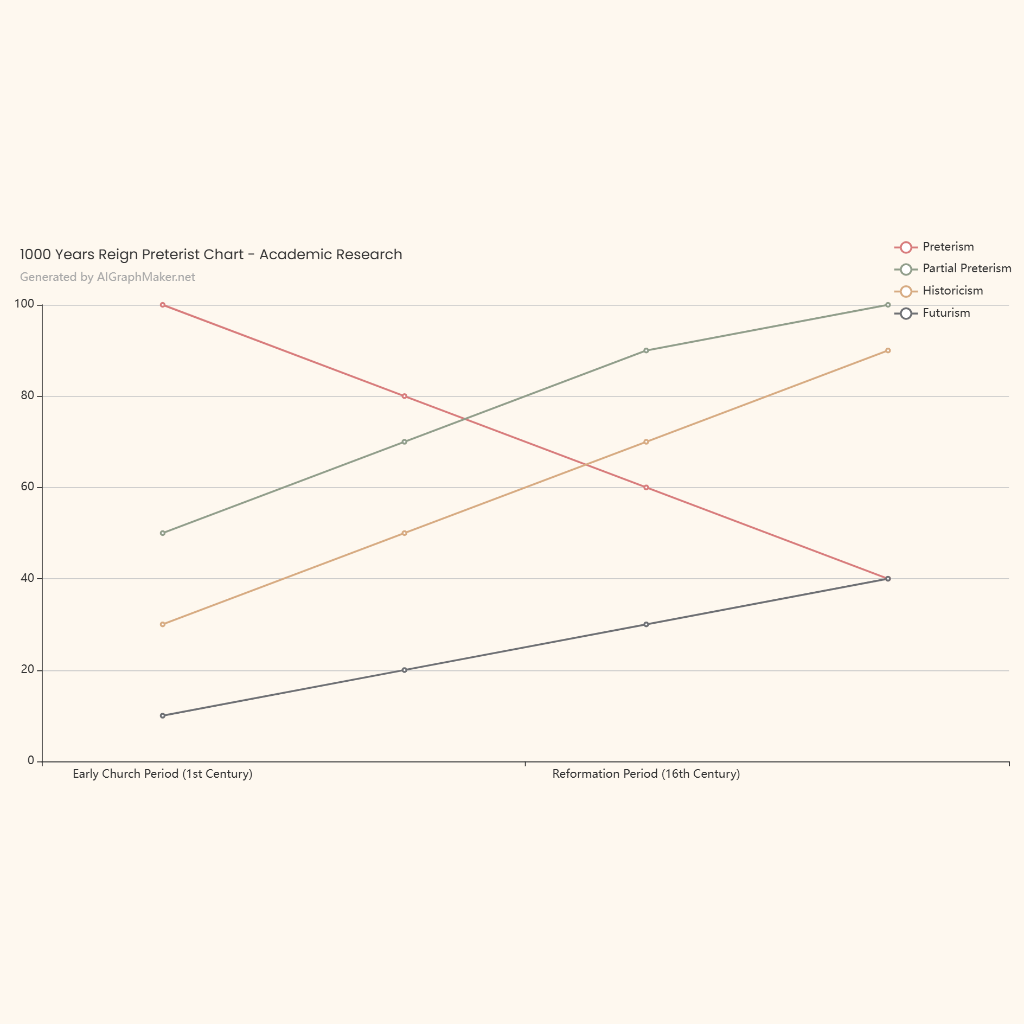
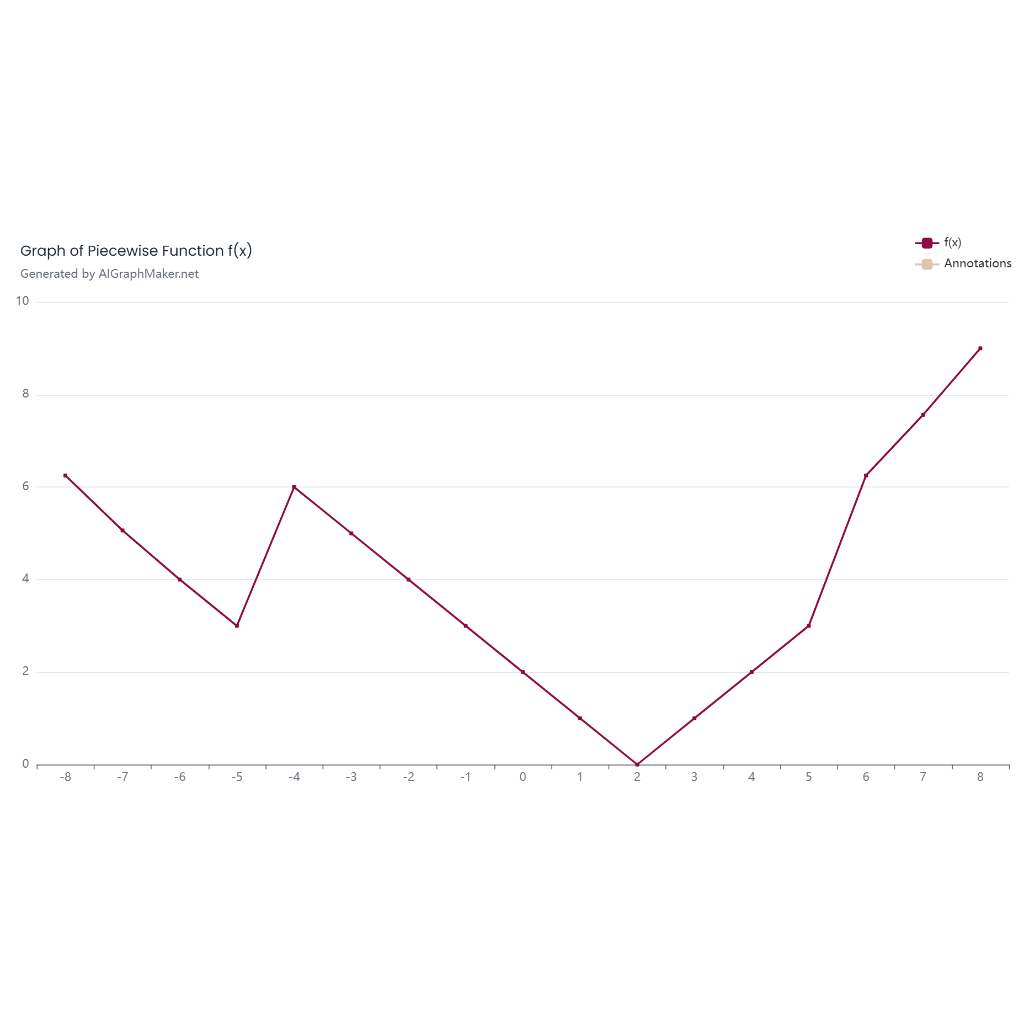
make the line thicker
1. Green Infrastructure – Urban Tree Planting
Data Table:
Increase in Urban Tree Canopy (%)
Estimated Reduction in PM2.5 (μg/m³)
0%
Baseline
5%
0.5 μg/m³
10%
1.0 μg/m³
15%
1.5 μg/m³
20%
2.0 μg/m³
Source: McDonald et al., 2016; See also Nowak et al. (2006) for overall pollutant removal estimates.
Graph Instructions:
Copy the table into Google Sheets.
Insert a line or bar chart with “Increase in Urban Tree Canopy (%)” on the X-axis and “Reduction in PM2.5 (μg/m³)” on the Y-axis.
Use this graph to illustrate the potential air quality improvement from increased urban vegetation.
