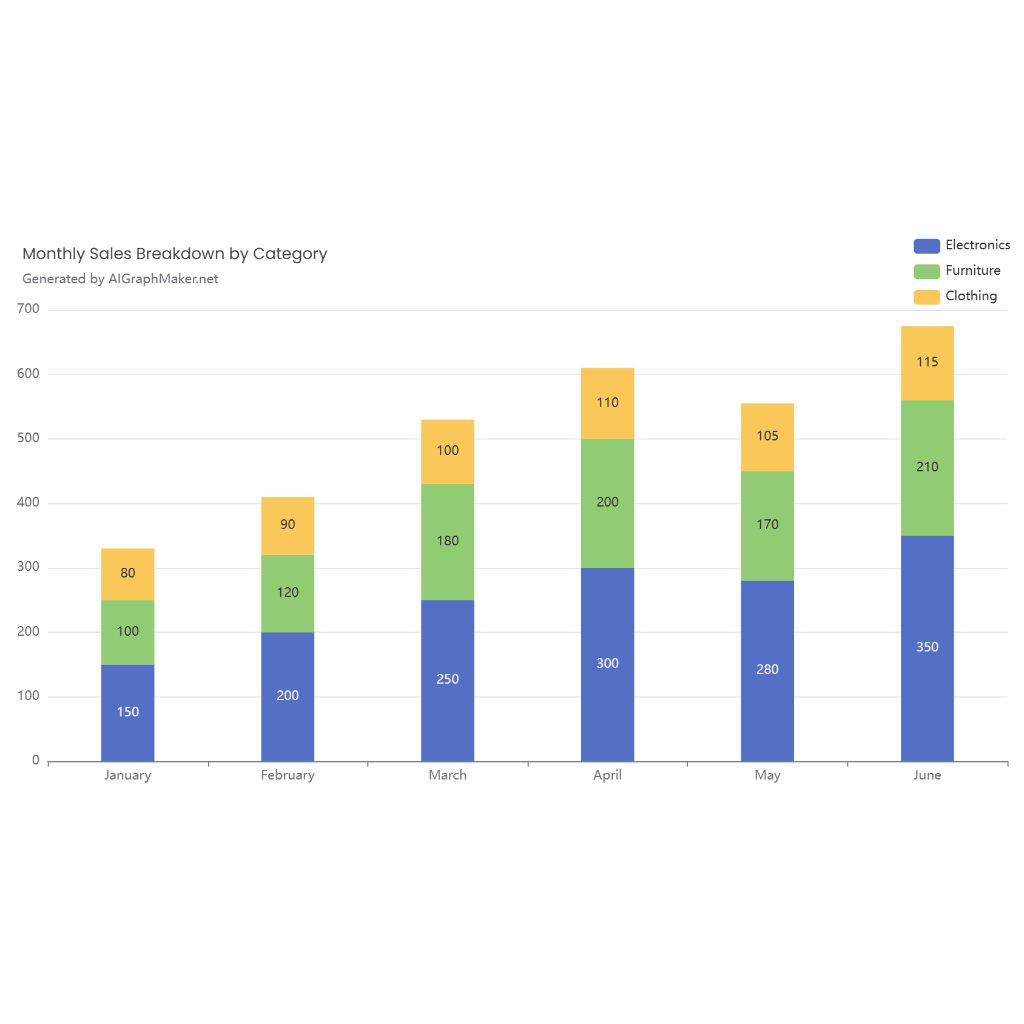
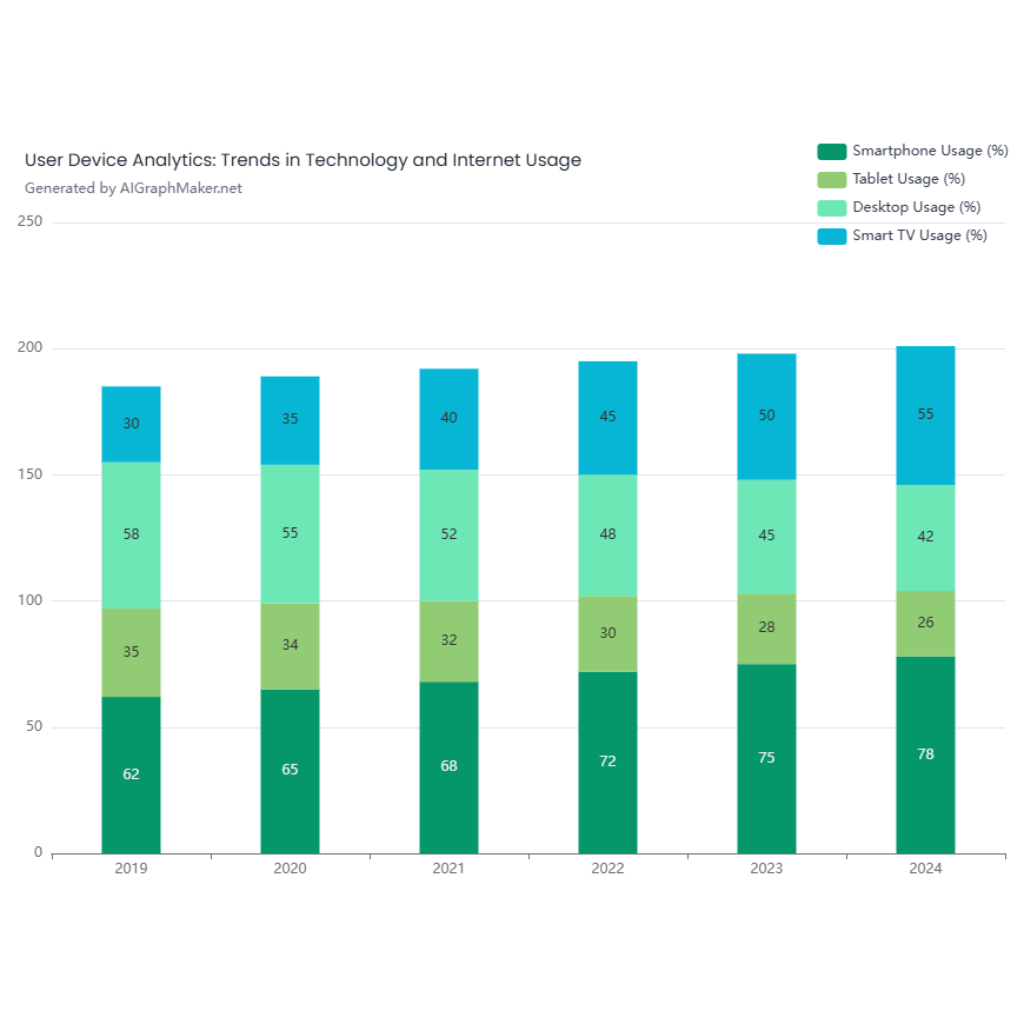
Generate a visually appealing bar chart comparing revenue projections for Realu based on the number of real estate transactions per year.
• X-Axis: Number of transactions per year (100, 500, 1000, 3000).
• Y-Axis: Revenue in Israeli Shekels (₪).
• Two Data Series:
• Minimum Revenue (10% of Brokerage Fee)
• Maximum Revenue (25% of Brokerage Fee)
• Use contrasting colors for the two data series.
• Add data labels on each bar to clearly show revenue values.
• Ensure the Y-axis scale adjusts dynamically to fit the largest revenue value (₪34,950,000).
• Title: “Projected Revenue vs. Number of Transactions for Realu”
• Axis Labels:
• X-Axis: “Number of Transactions per Year”
• Y-Axis: “Revenue in ₪ (Millions)”
• Use a modern, clean design with clear fonts and grid lines for readability.
• Optionally, add a subtle trend line to highlight the exponential growth pattern.”
Added on:
Mar 09, 2025
User Prompt
