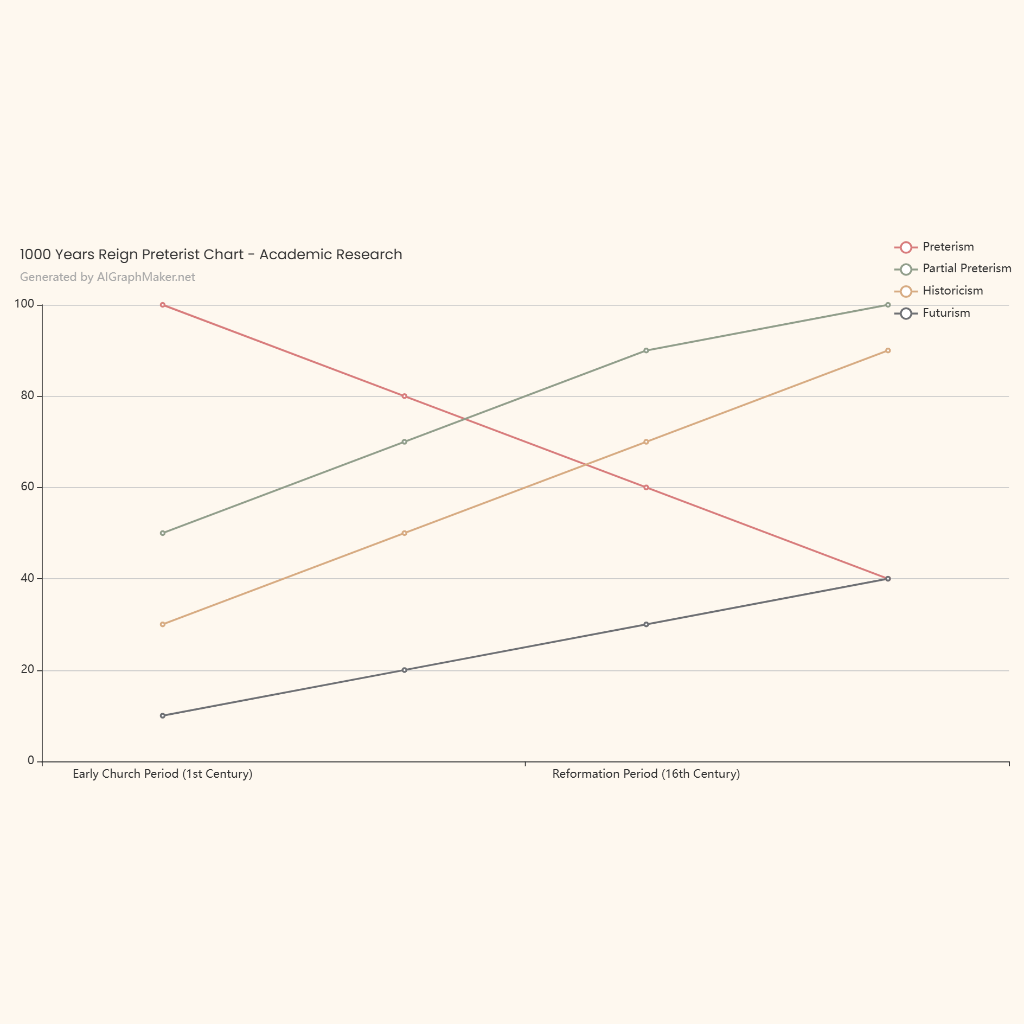
Behaviour Over Time Graphs show how key variables change over time, helping to identify trends, patterns, and feedback loops in the system.
Key Variables to Track:
Forced Labour: Declines after the abolition of slavery but persists in informal sectors.
Wage Labour: Increases post-abolition but remains exploitative due to low wages and poor conditions.
Poverty Levels: Remain high due to economic inequality and exploitative labour practices.
Corruption: Increases as weak institutions fail to enforce labour laws.
Union Representation: Remains low, limiting worker resistance and collective bargaining.
Graph Trends:
Forced Labour: Sharp decline after abolition (1807) but gradual increase in informal sectors (post-independence).
Wage Labour: Steady rise post-abolition, but wages stagnate due to exploitation.
Poverty Levels: Persistent high levels, with spikes during economic crises (e.g., Nigeria-Biafra War, COVID-19).
Corruption: Gradual increase as institutions weaken and bribery becomes normalized.
Union Representation: Minimal growth, with occasional spikes during labour protests.
