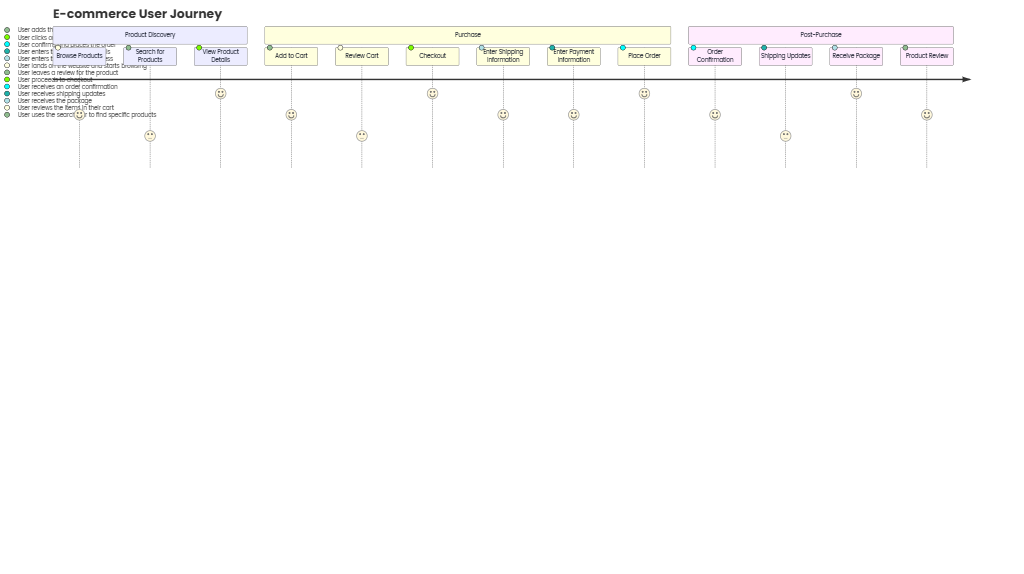
Generate a user journey graph for consumer behavior: Online shopping vs. in-store preferences.
Description
This user journey graph compares the decision-making processes and touchpoints of consumers choosing between online shopping and in-store experiences, highlighting key stages from initial awareness to post-purchase behavior.
Core Stages of the User Journey
The graph maps parallel journeys for Online Shopping and In-Store Preferences, emphasizing divergences in interactions, motivations, and pain points:
1. Awareness & Inspiration
- Online Shopping:
- Touchpoints: Social media ads, search engines (e.g., Google, Amazon), influencer reviews, retargeting banners.
- Behavior: Users research products via mobile apps or websites, comparing prices and reading ratings.
- In-Store Preferences:
- Touchpoints: Physical store displays, word-of-mouth, local ads, window shopping.
- Behavior: Users may visit stores impulsively or after seeing in-store promotions (e.g., sales signs).
2. Consideration & Evaluation
- Online Shopping:
- Key Actions: Adding items to carts, using filters (price, brand, reviews), checking delivery options (e.g., same-day shipping), accessing loyalty programs.
- Tools: Price-comparison websites, virtual try-ons (e.g., AR for fashion), live chat support.
- In-Store Preferences:
- Key Actions: Examining product quality firsthand, testing samples (e.g., cosmetics, electronics), interacting with sales staff for recommendations.
- Tools: In-store kiosks for inventory checks, loyalty card swipes, tactile product evaluation.
3. Purchase Decision
- Online Shopping:
- Triggers: Discount codes, limited-time offers, one-click purchasing, saved payment methods (e.g., Apple Pay).
- Barriers: High shipping costs, complex return policies, security concerns (e.g., credit card fraud).
- In-Store Preferences:
- Triggers: Immediate gratification, personalized service, cash payments, avoiding shipping delays.
- Barriers: Long checkout lines, limited stock, transportation costs/time.
4. Post-Purchase Experience
- Online Shopping:
- Touchpoints: Order confirmation emails, delivery tracking, post-purchase surveys, social media sharing (e.g., “Unboxing” videos).
- Behavior: Product reviews, returns/exchanges via courier, reordering through saved carts.
- In-Store Preferences:
- Touchpoints: Receipts, in-store returns, loyalty rewards updates, follow-up emails.
- Behavior: Repeat visits for complementary products, word-of-mouth referrals, feedback via suggestion boxes.
5. Loyalty & Advocacy
- Online Shopping:
- Drivers: Personalized recommendations (e.g., “Customers who bought this also liked…”), loyalty points, referral programs.
- Outcomes: Subscription services, app notifications for restocks, brand advocacy via social media.
- In-Store Preferences:
- Drivers: In-store events (e.g., product launches), exclusive in-person discounts, staff familiarity.
- Outcomes: Membership in store-specific loyalty clubs, offline brand advocacy (e.g., recommending to friends).
Key Divergences in Behavior
FactorOnline ShoppingIn-Store Preferences
Primary Motivation
Convenience, price comparison, 24/7 access
Tangible experience, immediate need fulfillment
Trust Drivers
Reviews, brand reputation, secure payment gateways
Sales staff expertise, product testing
Pain Points
Shipping delays, sizing issues (clothing)
Limited parking, crowded spaces
Tech Integration
AI recommendations, chatbots
Self-checkout kiosks, RFID tagging
Environmental Impact
Packaging waste, carbon footprint of deliveries
Energy use in stores, transportation emissions
Visual Representation Tips
- Color Coding: Use distinct colors for online (e.g., blue) and in-store (e.g., green) journeys to highlight parallel stages.
- Touchpoint Symbols: Use icons (e.g., ? for mobile apps, ? for stores) to represent key interactions.
- Flow Arrows: Show decision branches (e.g., “Abandon Cart” in online vs. “Leave Store” in in-store) and convergence points (e.g., both journeys leading to post-purchase reviews).
- Emotion Labels: Annotate stages with emotional cues (e.g., “Frustration” during long checkout lines, “Satisfaction” from quick online delivery).
Strategic Insights for Brands
- Omnichannel Integration: Bridge gaps by offering BOPIS (Buy Online, Pick Up In-Store) or in-store returns for online purchases.
- Personalization: Use data from online searches to tailor in-store displays (e.g., show trending online products in physical aisles).
- Pain Point Mitigation:
- Online: Simplify return processes and offer free shipping thresholds.
- In-Store: Implement mobile checkout apps to reduce line wait times.
- Sustainability Messaging: Highlight eco-friendly options in both channels (e.g., reusable packaging for online, energy-efficient stores).