Added on:
May 07, 2025
User Prompt
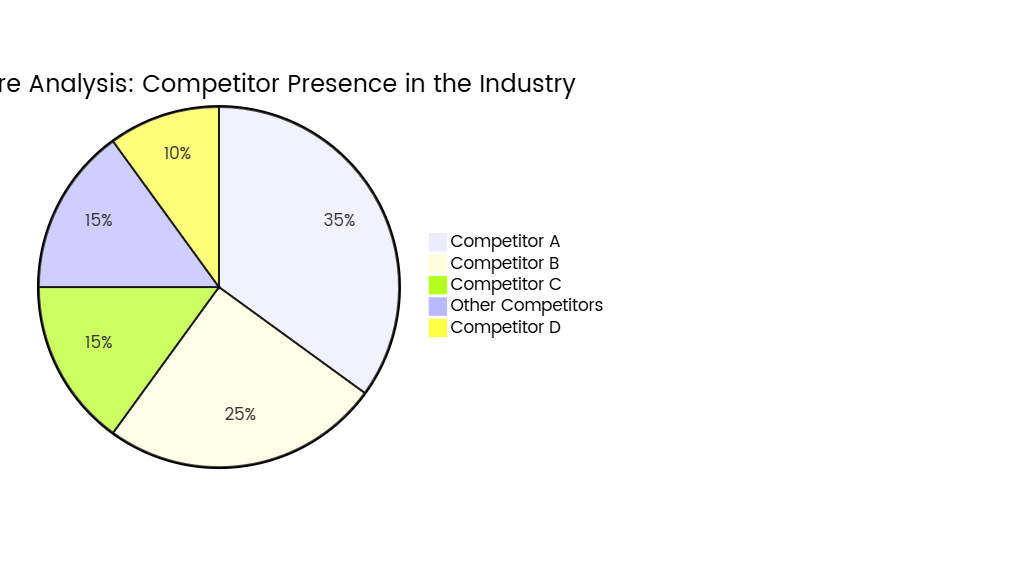
Quadrant Chart for Market Analysis: Evaluating Competitors Based on Market Share and Growth Potential
Description
A quadrant chart for market analysis evaluates competitors by plotting them on a grid based on market share and growth potential. The x-axis represents market share, from low to high, while the y-axis indicates growth potential, also ranging from low to high. This visualization categorizes competitors into four groups: Leaders (high share, high growth), Challengers (low share, high growth), Defenders (high share, low growth), and Nichers (low share, low growth). It helps businesses identify strategic opportunities and threats in the market landscape.