Added on:
May 07, 2025
User Prompt
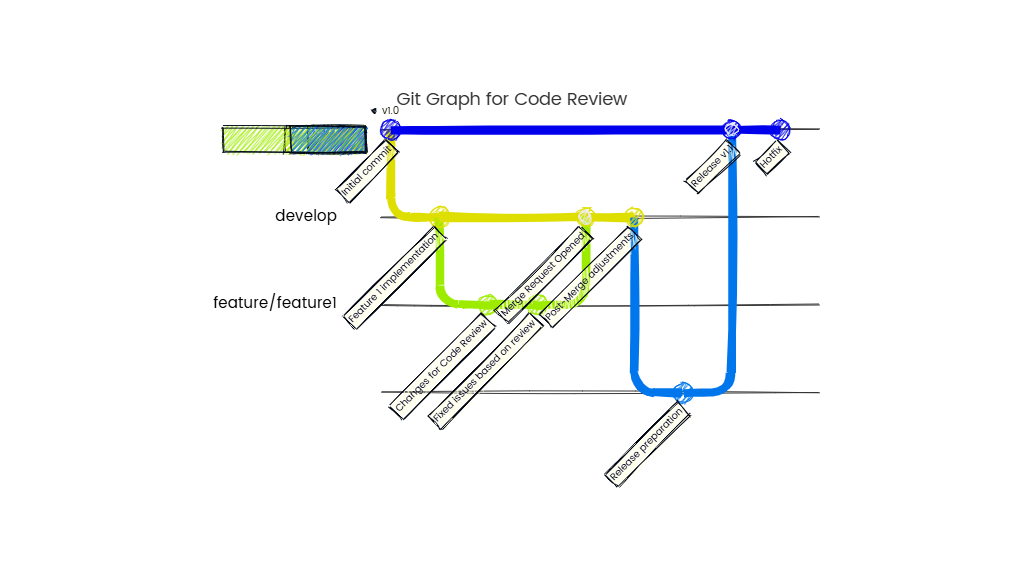
Git Graph for Team Collaboration: Visualizing Commit History and Branch Merges
Description
A Git graph is a powerful visualization tool that maps the commit history and branch interactions in a collaborative software project, enabling teams to track changes, resolve conflicts, and maintain a shared understanding of the codebase evolution.
Key Components of a Git Graph
- Commits
- Represented as nodes (circles or dots) labeled with commit hashes (e.g.,
a1b2c3). - Each commit includes metadata: author, timestamp, message (e.g., "Fix login bug").
- Represented as nodes (circles or dots) labeled with commit hashes (e.g.,
- Branches
- Directed lines (arrows) connecting commits, showing the sequence of development.
- Main/Trunk: The primary branch representing the stable codebase.
- Feature Branches: Forks from main (e.g.,
feature/login-form) for isolated development. - Release Branches: Dedicated to preparing versions for deployment (e.g.,
release/v1.0).
- Merges
- Junctions where branches converge, marked by arrows merging into a common commit.
- Fast-Forward Merge: Occurs when the target branch has no new commits since the source branch diverged.
- 3-Way Merge: Combines changes from two branches with a common ancestor, often requiring conflict resolution.
- Tags
- Mark specific commits (e.g.,
v1.0.0) to denote milestones (releases, hotfixes).
- Mark specific commits (e.g.,
- Remote References
- Indicated by labels like
origin/main, showing the state of branches in the remote repository.
- Indicated by labels like
Example Workflow in a Git Graph
- Initial Development
- Commits (
C1,C2,C3) are made onmainbranch. - Tag
v0.1.0marks the first stable release.
- Commits (
- Feature Branch Creation
- Developer A creates
feature/new-dashboardfrommain(C3) and adds commits (C4,C5). - Developer B creates
feature/payment-gatewayfrommain(C3) and adds commits (C6,C7).
- Developer A creates
- Merging Features
feature/new-dashboardis merged intomainvia a fast-forward merge (C8).feature/payment-gatewayrequires a 3-way merge (C9) due to conflicts withC5inmain.
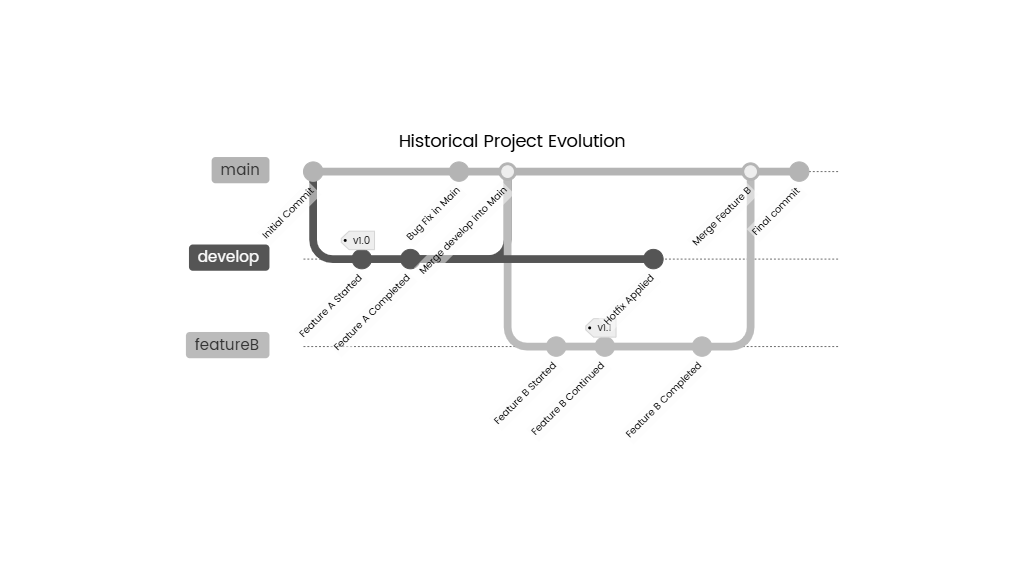
- Hotfix & Release
- A critical bug in
maintriggers the creation ofhotfix/bug-123frommain(C9). - After fixing the bug (
C10),hotfix/bug-123is merged intomainand taggedv0.1.1.
- A critical bug in
- Long-Running Branches
- A
developbranch tracks ongoing development, withmainreserved for stable releases. - Feature branches (
feature/*) are created from and merged back intodevelop.
- A
Benefits of Using a Git Graph
- Visual Clarity
- Teams quickly identify who made changes, when, and how branches interact.
- Example: A developer can trace why a bug was introduced by reviewing commits in the affected branch.
- Conflict Resolution
- Merges requiring manual intervention (e.g., conflicting changes to
app.js) are visually highlighted. - Tools like
git log --graphor GitHub’s Visual Graph help pinpoint problematic commits.
- Merges requiring manual intervention (e.g., conflicting changes to
- Release Management
- Tags and release branches provide clear markers for deployment milestones (e.g.,
v2.0.0).
- Tags and release branches provide clear markers for deployment milestones (e.g.,
- Audit & Compliance
- Commits are timestamped and linked to authors, supporting compliance with regulations (e.g., FDA for medical devices).
- Learning & Onboarding
- New team members understand project history by visualizing how features were developed and integrated.
Tools for Visualizing Git Graphs
- Command-Line:
git log --graph --oneline --decorate --all. - Integrated Tools: GitHub Desktop, GitKraken, SourceTree.
- IDE Plugins: VS Code’s GitLens, IntelliJ IDEA’s Git Visualization.