Added on:
May 07, 2025
User Prompt
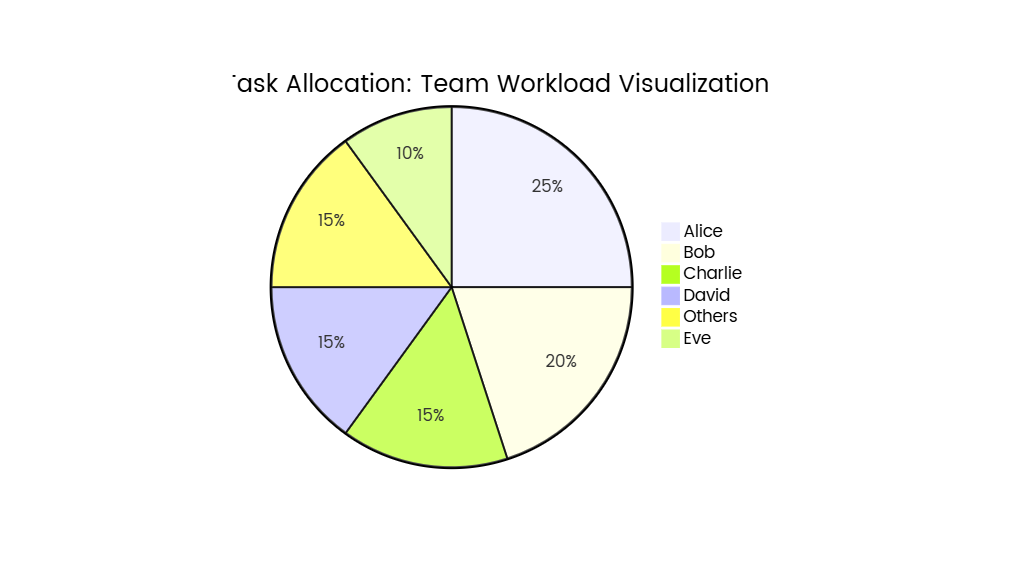
Pie Chart for Market Share Analysis: Visualizing Competitor Presence in the Industry
Description
This pie chart provides a visual breakdown of market share distribution among key competitors in an industry, illustrating each company’s proportional ownership of total sales or revenue. The chart is an essential tool for understanding competitive dynamics, identifying market leaders, and assessing opportunities for growth or intervention.
Key Components of the Pie Chart
- Segments & Labels:
- Each slice represents a competitor or market category (e.g., Company A, Company B, Company C, and a combined “Others” segment for smaller players).
- Example Labels:
- Company A: 35% (Market Leader)
- Company B: 25% (Second Largest Player)
- Company C: 15% (Emerging Competitor)
- Others: 25% (Smaller Entities or Niche Players)
- Color Coding:
- Distinct colors differentiate competitors for quick identification (e.g., blue for Company A, green for Company B, red for Company C).
- The “Others” segment may use a neutral color (e.g., gray) to group non-major players.
- Data Source:
- Market share data is typically based on revenue, unit sales, or customer base, sourced from industry reports (e.g., Statista, Gartner), market research firms, or company financial disclosures.
- Title & Annotations:
- Title: Clearly states the industry and timeframe (e.g., “Market Share of Global Smartphone Manufacturers – 2024”).
- Annotations: Highlight key insights directly on the chart (e.g., “Company A leads with 35% share,” “Collective ‘Others’ segment holds 25%”).
Interpreting the Pie Chart
- Market Leadership:
- The largest slice (Company A, 35%) indicates the dominant player, which may have strong brand recognition, economies of scale, or technological advantages.
- Competitive Landscape:
- Company B (25%) and Company C (15%) are secondary competitors. Company B’s share suggests a strong but not dominant position, while Company C’s growth may signal innovative strategies (e.g., new product lines, regional expansion).
- Opportunities & Threats:
- Opportunities: The “Others” segment (25%) may include fragmented players, presenting opportunities for market consolidation or niche targeting.
- Threats: A highly concentrated market (e.g., top three players holding 75%) could indicate barriers to entry for new competitors.
- Trend Comparison (Optional):
- For longitudinal analysis, compare multiple pie charts across years to observe shifts (e.g., Company C’s share increasing from 10% to 15% over two years).
Strategic Implications
- For Market Leaders (e.g., Company A):
- Focus on maintaining share through innovation, customer retention, or pricing strategies.
- Monitor emerging threats from Company C or the “Others” segment.
- For Challengers (e.g., Company B):
- Target gaps in Company A’s offerings (e.g., premium vs. budget markets) or improve operational efficiency to compete on cost.
- For New Entrants or Niche Players:
- Leverage the “Others” segment’s diversity to carve out specialized markets (e.g., eco-friendly products, regional customization).
- Industry Analysis:
- A highly fragmented “Others” segment may indicate low brand loyalty or high market volatility, while a dominant player suggests a mature or monopolistic industry.
Design Best Practices
- Simplify for Clarity:
- Limit the number of individual segments to 5–7; combine smaller competitors into “Others” to avoid clutter.
- Proportional Accuracy:
- Ensure slice sizes reflect precise percentages (use data visualization tools to calculate angles automatically).
- Contextualize with Data:
- Include total market size (e.g., “Total Revenue: $50 Billion”) to provide scale for percentage values.
- Avoid Misleading Visuals:
- Use a flat 2D pie chart (avoid 3D effects, which can distort proportions) and ensure the chart is properly scaled (no truncated axes).
Example Scenario: Global Electric Vehicle (EV) Market
- Segments:
- Tesla: 28%
- BYD: 22%
- Volkswagen Group: 15%
- Others: 35%
- Insights:
- Tesla and BYD together hold 50% of the market, reflecting their dominance in EV manufacturing.
- The “Others” segment includes traditional automakers (e.g., Toyota, GM) and new startups, indicating ongoing competition and innovation.